2025-1-17 22:30 |
Bullish momentum has returned in the general crypto market bolstering major digital assets such as Solana toward an upward direction once again. As SOL gains traction, certain key indicators and chart formation are pointing to a potential upsurge for the altcoin in the upcoming weeks.
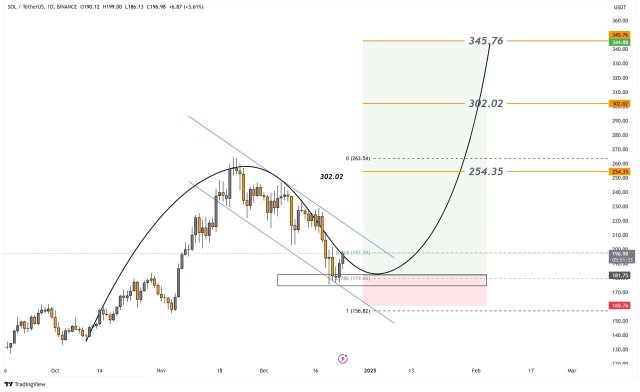
An Impending Move To Higher Levels For SolanaRecent price action shows that Solana could be on the brink of a significant upswing. Market technician and investor Jonathan Carter points to a move that might spark a rally close to SOL’s current all-time high of $264.
The expert cites a possible bullish breakout from a critical chart formation, particularly the Descending Triangle pattern that will fuel the anticipated huge upsurge. His chart shows that SOL is at a crucial junction, hinting at a continuation of its upside momentum if the asset breaches current resistance levels.
It is important to note that descending triangle formations are bearish chart patterns formed by a series of lower highs and a lower resistance level. However, Jonathan Carter highlighted that the altcoin is maintaining its position above the lower edge of the chart formation in the 8-hour time frame.
Currently, SOL’s upward momentum is being faced by a robust resistance provided by the broken ascending lower line. Should the altcoin surpass this strong resistance, the expert is confident that SOL might experience a rally to the $262 threshold. Other key price levels to watch along the way include $204, $222, and $245.
Carter’s prediction coincides with growing optimism in the general crypto market as Solana continues to gain recognition for its robust network activity and expanding user base. Given the growing upward strength coupled with the heightened adoption, the breakout may trigger a recovery of its current peak, cementing its position as a top-performing altcoin.
SOL’s Path To $200 And Beyond Holds StrongSolana seems to be poised for a notable run in the coming days following a recent market uptrend. Pro-crypto trader and analyst Natalie Dormer also foresees a path to the $200 mark and beyond for Solana amid macroeconomic conditions like the US10 Government bonds.
Natalie Dormer’s optimistic forecast is triggered by a breakout from a solid bullish flag pattern, indicating an extension of its upward move. According to the expert, SOL’s breakout from the formation can be linked to the US CPI data, which was generally mixed and somewhat lower than expected.
Following the announcement of the CPI data, US10 Government bonds dropped sharply by almost 3%, leading to weakness in USD-related assets. Thus SOL now has a better chance of increasing further, targeting $211 and a maximum of $230 based on the current data as indicated in her chart.
Presently, Solana has risen to the $202 level, demonstrating an almost 7% increase in the past day. This renewed strength has rekindled investors’ positive sentiment as its daily trading volume has spiked by over 61%.
origin »Bitcoin price in Telegram @btc_price_every_hour
Selfkey (KEY) на Currencies.ru
|
|