2022-8-18 21:10 |
Solana (SOL) price has enjoyed a winning streak by a whopping 75% as seen in the past two months after it has capsized to a mere $25.75.
SOL forms head-and-shoulders pattern hinting at bearish movement. Solana’s 75% gain witnessed in the past two months may be a potential fake-out. SOL price down by 2.40% and trading at $42.86 as of press time.However, the gains may prove to just lead the traders on due to an impending bearish movement. Does this hint at a potential bullish fake-out?
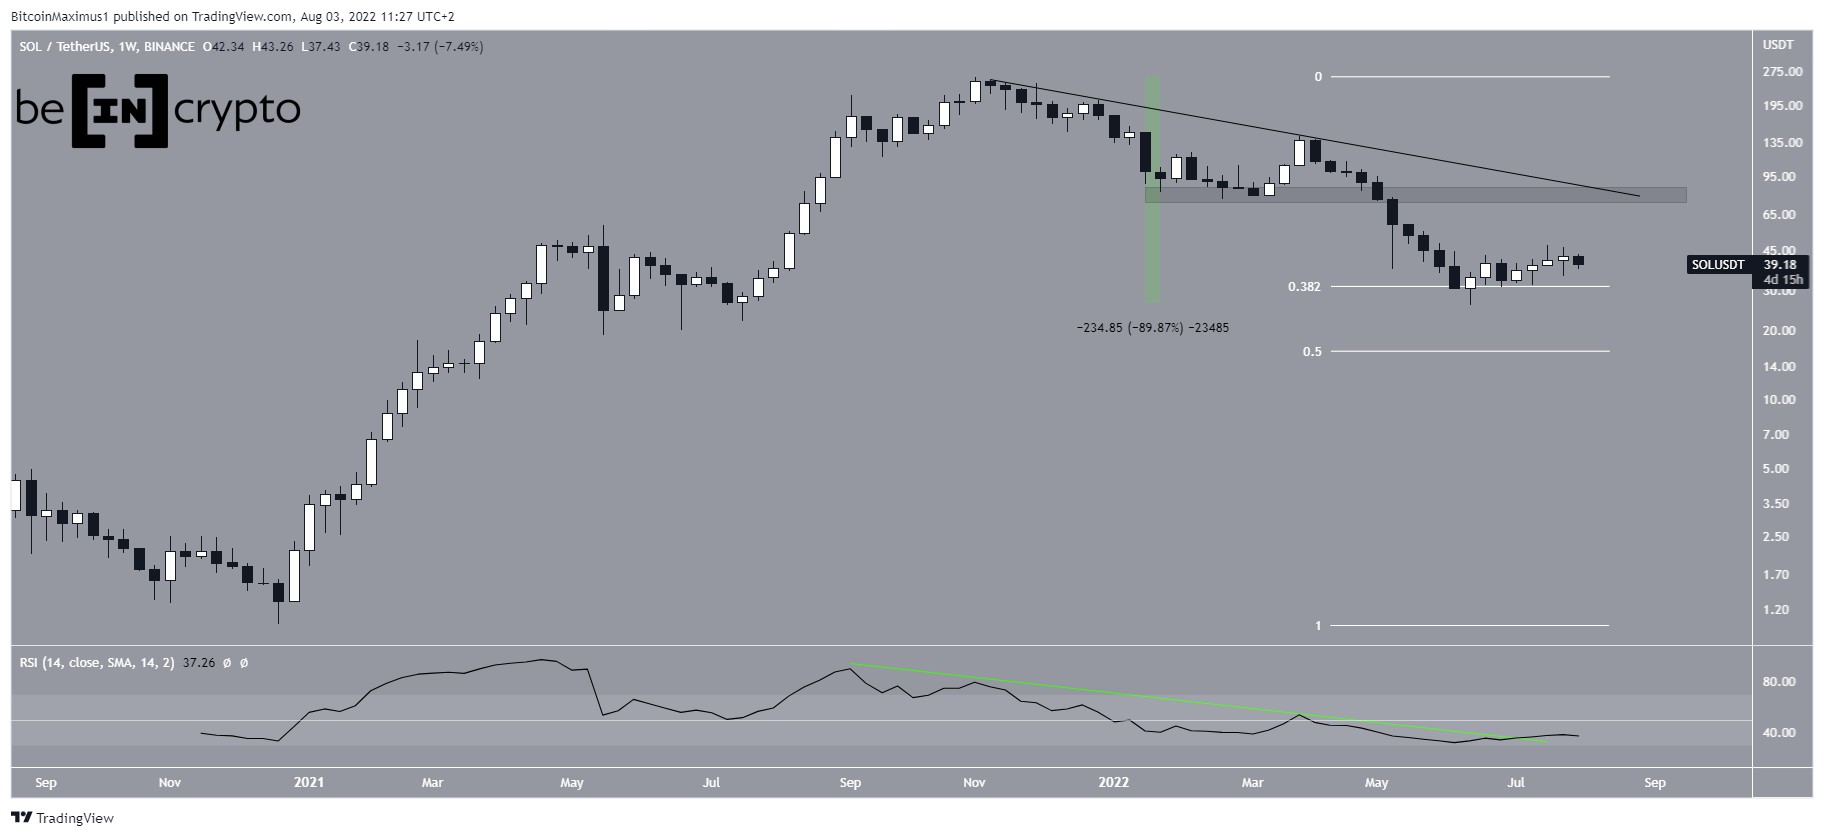
SOL formed a head-and-shoulders pattern which can be resolved once the price breaches below the neckline. Solana has been showing a consistent bearish outlook as seen on the charts.
SOL Forms H&S Pattern; Indicates A Bearish StandpointJudging by the weekly chart, SOL has formed the right shoulder or a part of the H&S pattern which indicates a correction reaching $27 that could happen sometime in the second quarter of 2022. Inevitably so, a breach below the $27 zone could trigger a correction moving towards $2.80.
More so, a decline in token price by 95% may occur at the end of 2022 or the early part of 2023 as forecasted by Profit Blue, a crypto analyst.
According to CoinMarketCap, Solana price has nosedived by 2.40% or trading at $42.86 as of this writing.
Solana’s bearish behavior has become apparent as it’s impacted by Fed issues and trends that put the market at high risk. SOL recently closed the week with a profit of 10.5% on August 14 which is close to that of Bitcoin’s. It seems that the market has reacted to the U.S. consumer price index (CPI) which cites the possibility of Fed halting the increase in interest rates.
Solana 75% Gains – A Fake-Out?In connection to this, analysts have already warned traders of these price rallies which historically hint a bearish breakout. In essence, the fakeout of SOL in line with its 75% gains may be true.
SOL also has a lot of issues to fix such as network outages and also centralization but the project developers have upgrades in place to correct these pressing problems.
Solana’s next big plunge could provide the token the opportunity to bounce close to the ascending trendline. Simply put, the bearish movement of SOL could go on until the price peaks at $20 which corresponds to a 55% drop from its price on August 16.
SOL total market cap at $14.3 billion on the daily chart | Source: TradingView.com Featured image from Analytics Insight, chart from TradingView.com origin »Bitcoin price in Telegram @btc_price_every_hour
Sola (SOL) на Currencies.ru
|
|