2021-12-30 20:44 |
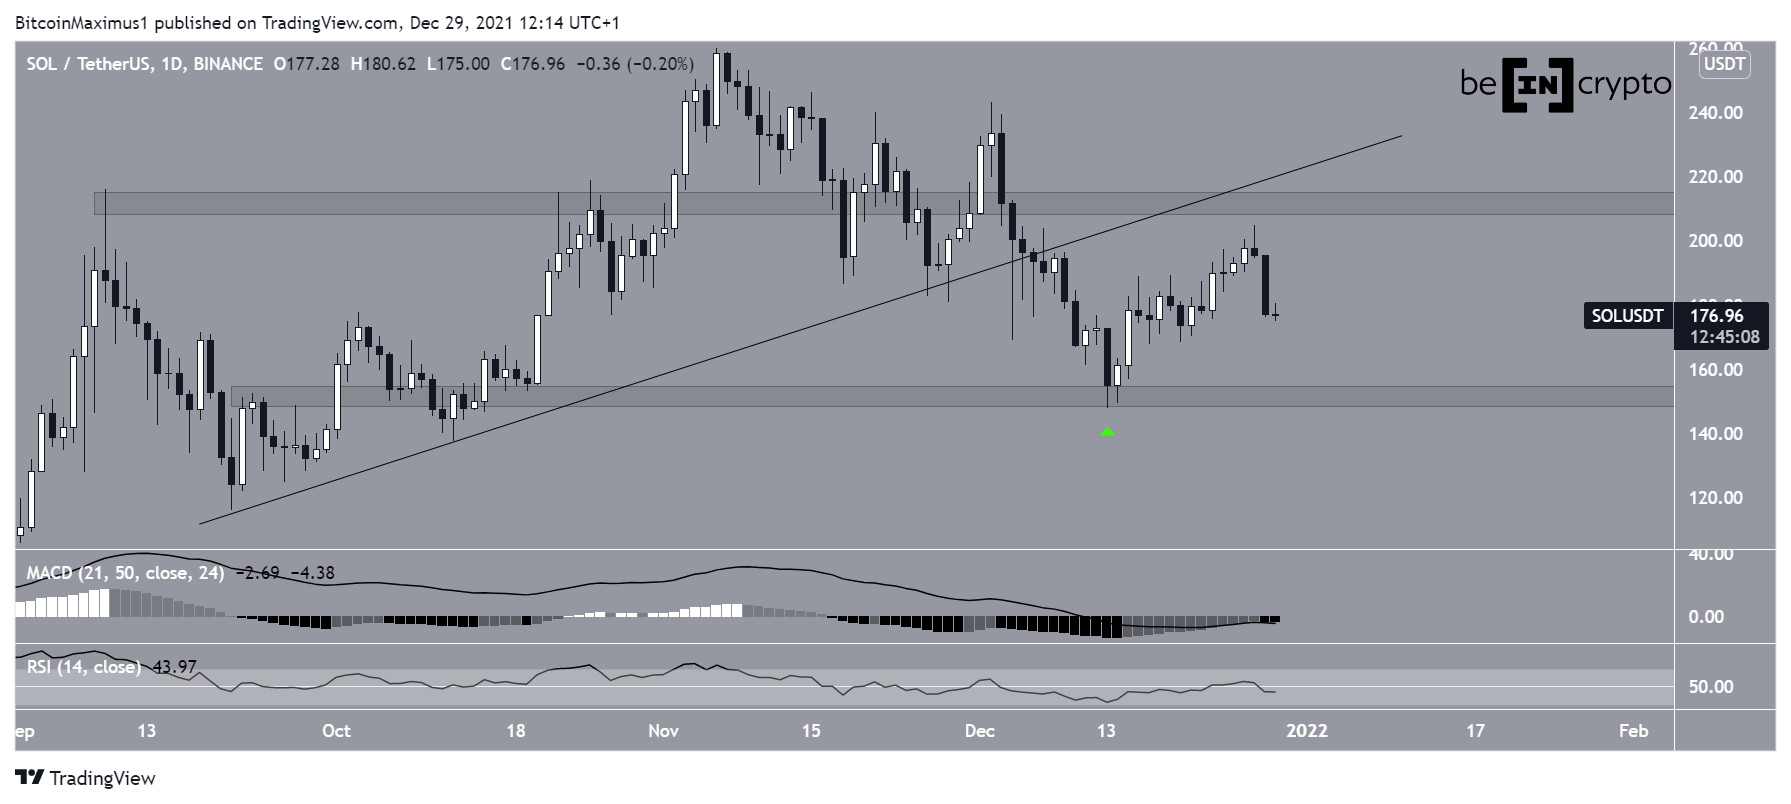
Solana (SOL) has bounced considerably since its Dec 14 lows, but is consolidating inside a horizontal range with relatively neutral movement.
SOL has been falling since reaching an all-time high price of $259.9 on Nov 6. The downward movement continued until a low of $148 was reached on Dec 13 (green icon). While it bounced afterwards, it has not reclaimed the previous support line yet.
Technical indicators are neutral.
The MACD, which is created by a short- and a long-term moving average (MA), is moving upwards but is not yet positive. This means that while the short-term MA is accelerating, it is not yet faster than the long-term one.
The RSI, which is a momentum indicator, is right at the 50 line. This is a sign of a neutral trend.
Therefore, it is possible that SOL continues trading inside this range for a period of time.
Chart By TradingView Short-term movementCryptocurrency trader @TradingTank outlined a SOL chart, stating that the token is likely to increase since it has reclaimed the $175 horizontal area.
Source: TwitterSince the tweet, SOL proceeded to reach a high of $204.75 but fell shortly afterwards.
Currently, it is back inside the $170-$176 horizontal support, created by the 0.5-0.618 Fib retracement support levels and a horizontal support area.
In order for the upward movement to continue, it is crucial that SOL creates a higher low inside this area.
However, there are no bullish reversal signs in either the MACD or RSI.
Therefore, the most likely scenario remains a continued consolidation inside the previously outlined range.
Chart By TradingView SOL/BTCThe SOL/BTC chart is more bullish than its USD counterpart. While the token is following a descending resistance line, it is also trading above the 33,500 satoshi support area. More recently, it bounced above this area on Dec 17 (green icon) and is currently attempting to break out from the descending resistance line.
The RSI is slightly above 50 and the MACD is positive, despite the fact that it is decreasing.
Therefore, it is possible that SOL/BTC will break out and move towards its all-time high of 46,700 satoshis.
Chart By TradingViewFor BeInCrypto’s latest Bitcoin (BTC) analysis, click here
The post Solana (SOL) Consolidates Inside Horizontal Range After All-Time High Correction appeared first on BeInCrypto.
origin »Bitcoin price in Telegram @btc_price_every_hour
Solana (SOL) на Currencies.ru
|
|