2023-3-7 08:07 |
Solana declined heavily below $22 against the US Dollar. SOL price could start a recovery wave if it stays above the key $20 support zone.
Sol price declined heavily and tested the $20 support zone against the US Dollar. The price is now trading below $22 and the 100 simple moving average (4-hours). There is a major bearish trend line forming with resistance near $21.60 on the 4-hours chart of the SOL/USD pair (data source from Kraken). The pair could rise further if it clears the $21.60 and $22.00 resistance levels. Solana Price Rallies Over 12%This past week, solana price started a major decline from well above the $23.50 level. The bears pushed the price below the $22 support zone and sparked a bearish wave, similar to bitcoin and ethereum.
The price even declined below the $20.50 support zone. A low was formed near $20.21 and the price is now consolidating losses. The price is now trading below $22 and the 100 simple moving average (4-hours). There is also a major bearish trend line forming with resistance near $21.60 on the 4-hours chart of the SOL/USD pair.
On the upside, an immediate resistance is near the $21.00 level. It is near the 23.6% Fib retracement level of the downward move from the $23.50 swing high to $20.21 low.
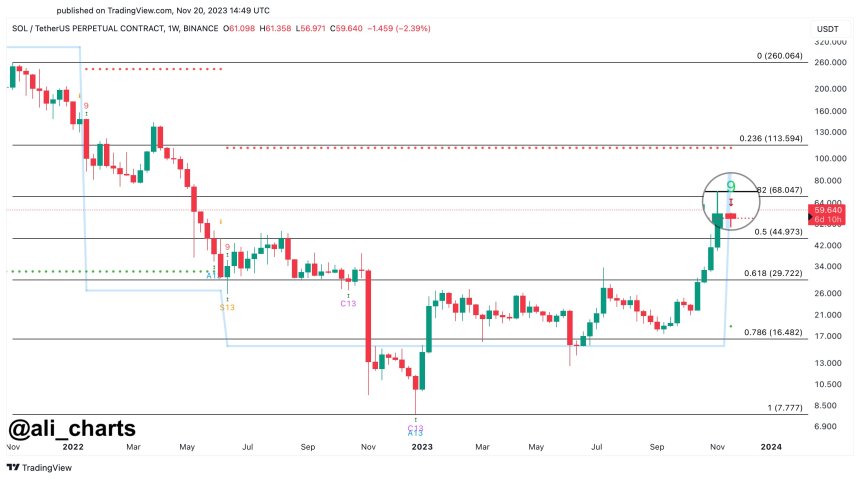
Source: SOLUSD on TradingView.com
The next major resistance is near the $21.50 level and the trend line. The main resistance is near the $21.80 zone. It is near the 50% Fib retracement level of the downward move from the $23.50 swing high to $20.21 low, above which the price could aim a move towards the $22.80 level. Any more gains might send the price towards the $24 level.
Downside Break in SOL?If SOL fails to clear the $21.60 resistance, it could continue to move down. An initial support on the downside is near the $20.20 level.
The first major support is near the $19.80 level. The next major support is near the $19.20 level. If there is a downside break below the $19.20 support, the price might test the next key support at $18.00.
Technical Indicators
4-Hours MACD – The MACD for SOL/USD is losing pace in the bearish zone.
4-Hours RSI (Relative Strength Index) – The RSI for SOL/USD is below the 50 level.
Major Support Levels – $20.20, $20.00 and $19.20.
Major Resistance Levels – $21.00, $21.80 and $24.
origin »Bitcoin price in Telegram @btc_price_every_hour
Sola (SOL) на Currencies.ru
|
|