2023-8-9 23:13 |
The Shiba Inu (SHIB) price has been on a tear since June 10, reclaiming a horizontal and diagonal long-term support level in the process.
The readings from both the weekly and daily timeframes support the continuing increase, suggesting that the trend is bullish.
Shiba Inu Price Reclaims Lost Long-Term LevelThe technical analysis from the weekly timeframe provides a bullish outlook. It shows that the SHIB price has been moving upwards since June 10, shortly after it broke down from a long-term symmetrical triangle pattern.
It bounced at the $0.0000060 support area at the time and created a long lower wick (green icon). This level has not been reached since the end of 2021.
Empower your investments with SHIB price predictions.
After bouncing, the price reclaimed both the $0.0000080 horizontal area and the triangle’s support line (green circle). Both these are considered signs that bulls have taken over and a bullish reversal has begun. At its highest point last week, the price had increased by 25% since the beginning of the week.
Before the increase, Shiba Inu whales had acquired 1.1 trillion SHIB tokens.
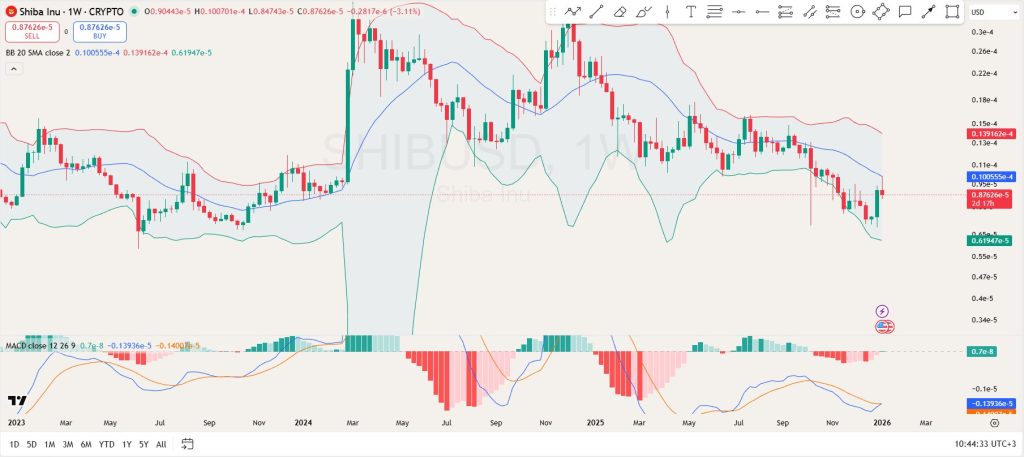
SHIB/USDT Weekly Chart. Source: TradingViewDespite this increase, the weekly Relative Strength Index (RSI) does not confirm the bullish trend reversal. With the RSI as a momentum indicator, traders can determine whether a market is overbought or oversold and decide whether to accumulate or sell an asset.
Bulls have an advantage if the RSI reading is above 50 and the trend is upward, but if the reading is below 50, the opposite is true. Even though the RSI is increasing, it is still below 50. An RSI movement above the 50 line and a price breakout from the previous triangle’s descending resistance line is required to confirm the bullish trend reversal.
Read More: Top 9 Telegram Channels for Crypto Signals in 2023
SHIB Price Prediction: Is Breakout Sign of Bullish Trend Reversal?Similarly to the weekly timeframe, the daily one also provides a bullish trend. The main reason for this is a breakout from a 158-day descending resistance line on July 12. The breakout then led to the reclaim above of a long-term horizontal support level.
However, SHIB was rejected by the 0.5 Fib retracement resistance level on August 5 (red icon). According to the Fibonacci retracement levels theory, following a significant price change in one direction, the price is expected to partially return to a previous price level before continuing in the same direction.
So, if the increase is indeed the beginning of a bullish trend reversal, the SHIB price will break out from the 0.5 Fib level and increase to the long-term triangle’s resistance line near $0.0000120.
The area is also very close to the 0.618 Fib retracement resistance level. It would amount to an increase of 34% measured from the current price.
SHIB/USDT Daily Chart. Source: TradingViewDespite this bullish SHIB price prediction, closing below the $0.0000080 support area will mean the price trend is still bearish. A drop to the closest support at $0.0000060 will be expected in that case. This would be a decrease of 33%.
More From BeInCrypto: 9 Best AI Crypto Trading Bots to Maximize Your Profits
For BeInCrypto’s latest crypto market analysis, click here
The post Shiba Inu (SHIB) Price Soared 25% Last Week: Is More Upside Ahead? appeared first on BeInCrypto.
origin »Bitcoin price in Telegram @btc_price_every_hour
SHIBA INU (SHIB) на Currencies.ru
|
|