2022-10-17 12:30 |
Quant (QNT) price has potentially reached a short-term top at $228.10. After a slight retracement, the final upward movement of the crypto could take the price to yet another yearly high.
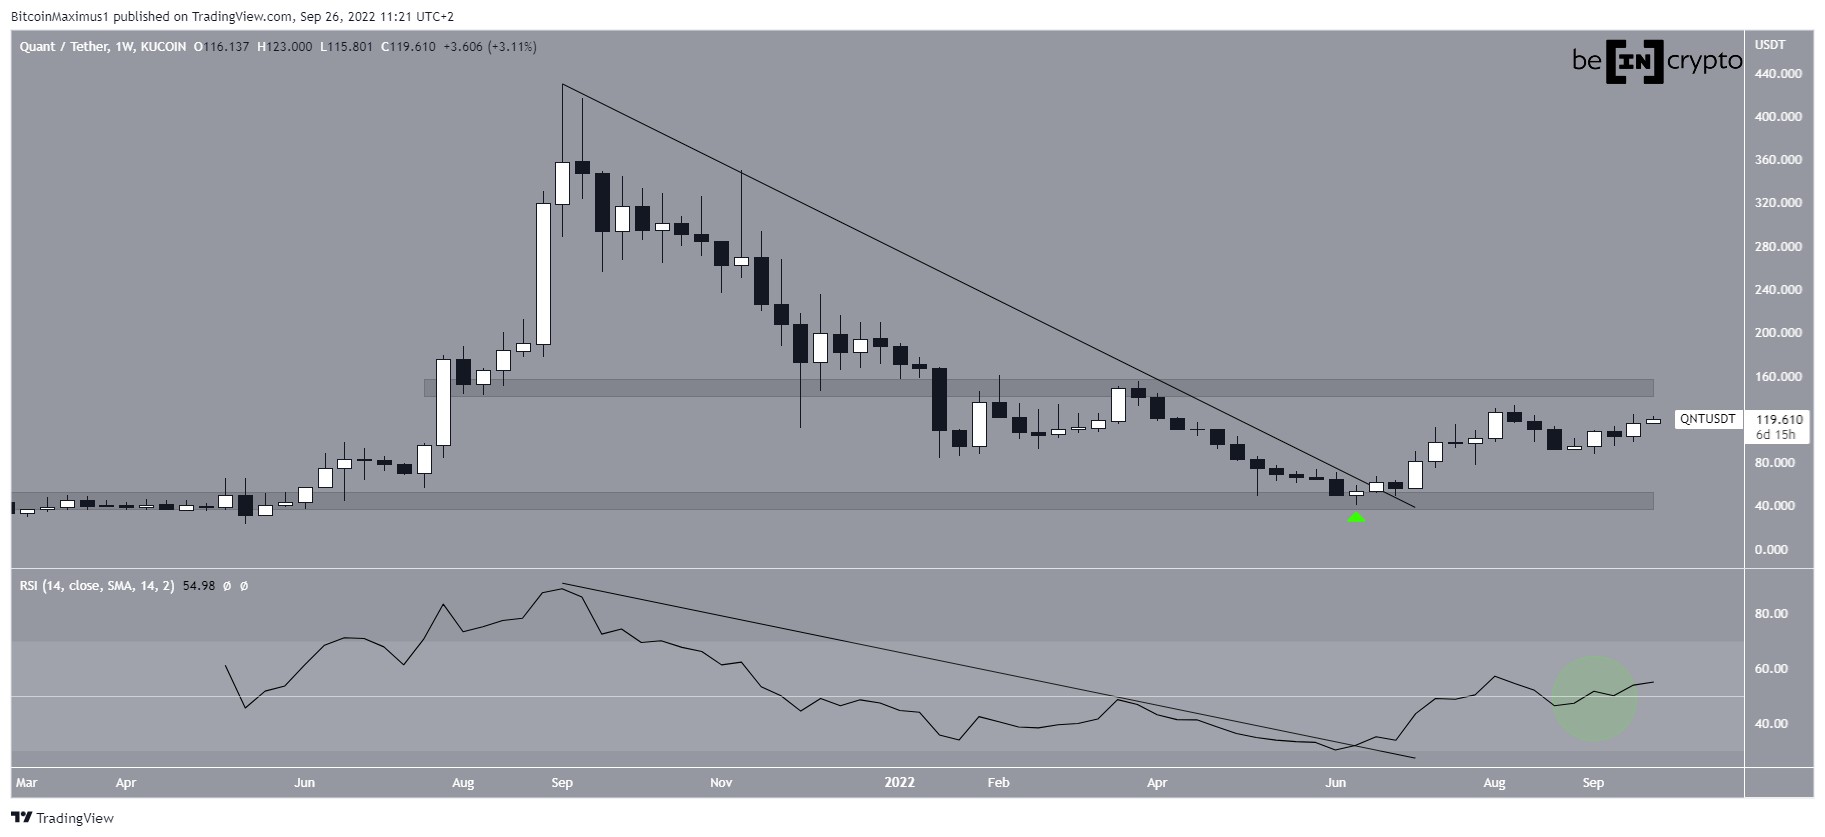
On June 15, QNT broke out from a descending resistance line that had been in place since the $429 all-time high price of Sept. 2021. Breakout from such long-term structures usually lead to a sharp upward movement, as was the case for QNT.
So far, the increase led to a new yearly high of $228.1. In doing so, the QNT price broke out from the crucial $190 level, which is both a horizontal resistance area and the 0.382 Fib retracement resistance level.
Additionally, it is worth mentioning that the upward movement was preceded by a weekly RSI breakout above both a descending resistance line (black) and the 50 line (white). While the RSI is now overbought, there is no bearish divergence in place yet.
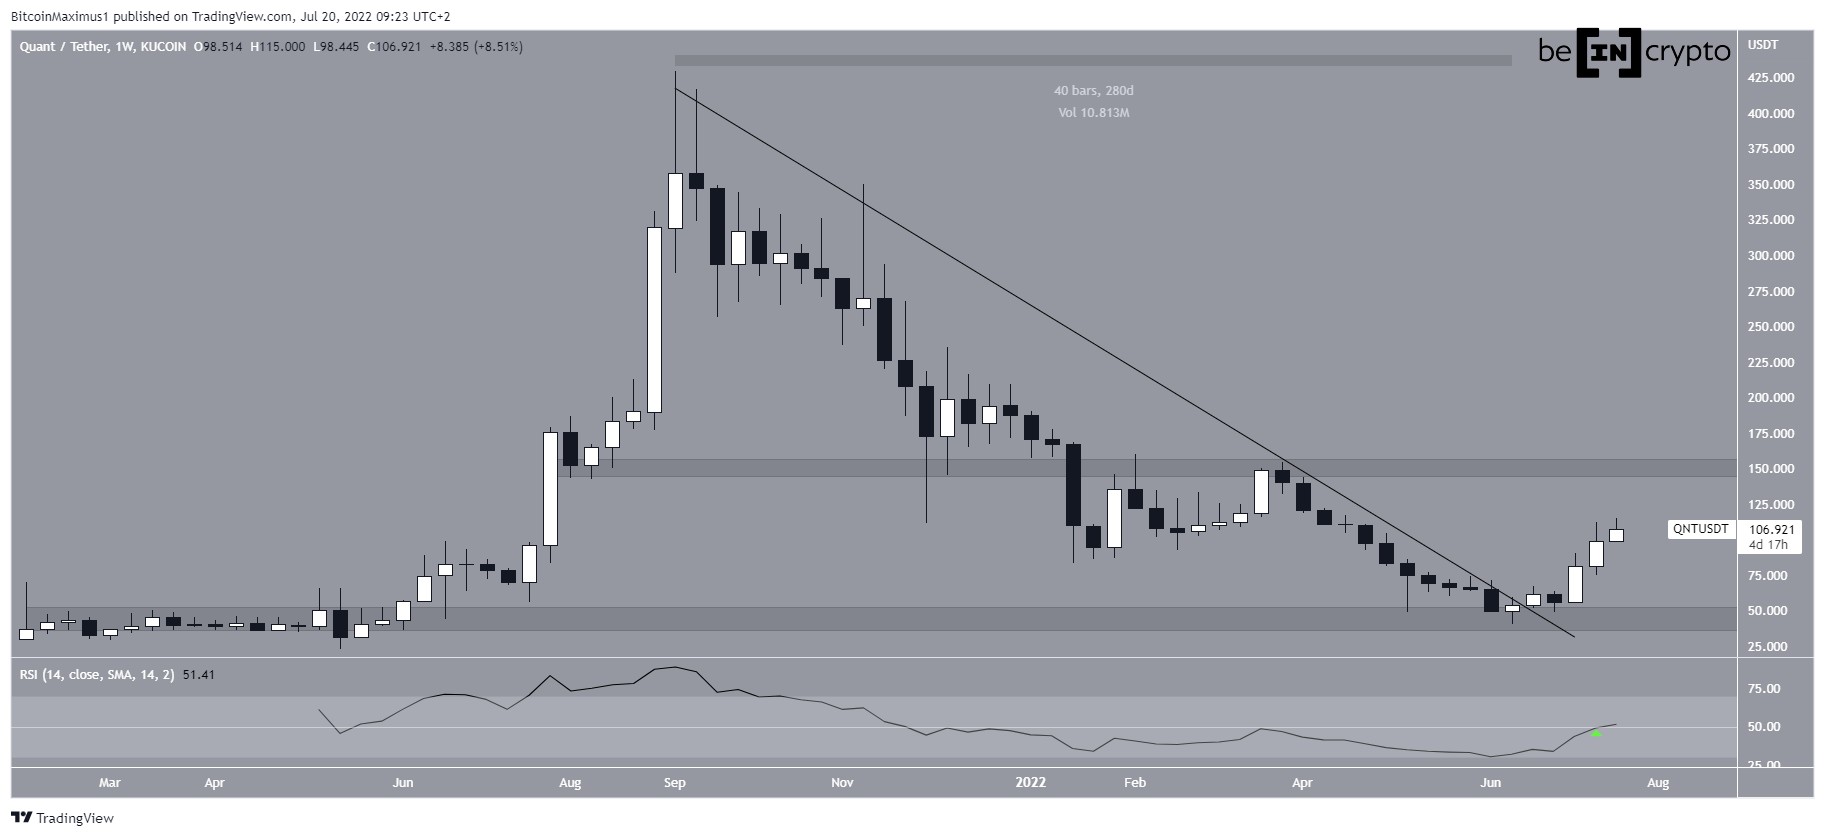
QNT/USDT Chart By TradingView QNT Price Breakout Confirms Impulsive MovementUntil Oct. 15, it was possible to contain the entire upward movement inside an ascending parallel channel. As a result, there was a possibility that the entire increase was corrective.
However, the ensuing breakout (green circle) confirmed that the movement is impulsive instead. Therefore, it is likely to be part of wave three in a five-wave upward movement (black).
The aforementioned $228.10 high gave waves one and three an exactly 1:1.61 ratio, which is common in bullish impulses. Due to this ratio and the creation of a long upper wick, it is likely that wave three is now complete.
So, the QNT price is expected to complete a fourth wave pullback between the 0.382 and 0.5 Fib retracement support levels at $174.2 to $157.6.
Afterward, the fifth and final wave of the bullish impulse can commence.
QNT/USDT Chart By TradingView Retracement Prior to RallyTo conclude, the QNT price seems to have reached a short-term top and completed wave three. Therefore, we predict a short-term period of retracement. Afterward, another upward movement.
In this retracement, the 0.382 to 0.5 Fib retracement support area at $158 to $174 is likely to act as the bottom.
For BeInCrypto latest Bitcoin (BTC) analysis and crypto market analysis, click here
Disclaimer: BeInCrypto strives to provide accurate and up-to-date information, but it will not be responsible for any missing facts or inaccurate information. You comply and understand that you should use any of this information at your own risk. Cryptocurrencies are highly volatile financial assets, so research and make your own financial decisions.
The post Quant (QNT) Price Reaches New Yearly High – Is a $300 Prediction Valid? appeared first on BeInCrypto.
origin »Bitcoin price in Telegram @btc_price_every_hour
ETH/LINK Price Action Candlestick Set (LINKETHPA) на Currencies.ru
|
|