2021-10-14 17:38 |
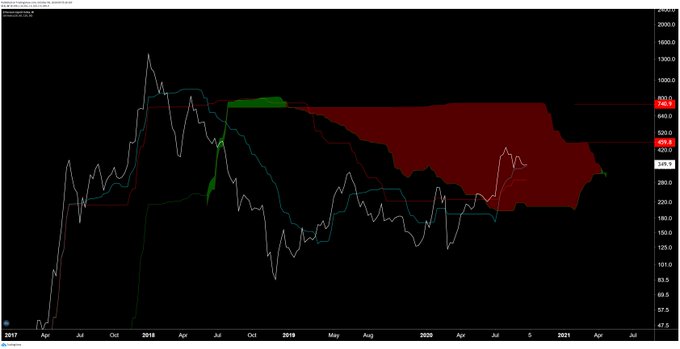
Matic’s price lost 8% on Tuesday. Yesterday, there were predictions that signaling sellers would assume control as the price remained below all key Ichimoku levels. Ichimoku is a collection of technical indicators that show support and resistance levels, as well as momentum and trend direction.
Disillusionment for bulls and bears alikeThe lateral, directionless trading behavior of the coin is disillusioning both bulls and bears. There have been warnings of near-term sell pressure as Matic remains below critical Ichimoku Cloud support levels. Matic dropped to new ten-day lows on Tuesday, but recovered near the end of the trading session. Buyers came in and rallied to recover losses.
Bear trap or bullish recovery?The erratic price action might be the beginning of a bear trap or signal a bullish recovery. The coin’s price remains below Ichimoku’s Senkou Span A and B, the Kijun-Sen and the Tenkan-Sen, which means daily outlook remains bearish, analysts report.
At around $1.19, buyers came in to show support. This value area is also the 38.2% Fibonacci retracement level. This means lower prices are highly likely if sellers push MATIC below that level. There is a very real risk of Matic going back down to the $0.65 level, and fast. At the time of publication, it was trading at $1.20.
Kumo Twist coming up on October 15Bulls can inflict great damage as the Kumo Twist for Matic’s price is coming up. Matic will have no problem moving through the Twist if the current short-term rally results in a short squeeze. The Twist, which is the thinnest part of the Cloud, has the potential to bring Matic to as much as $2.00.
Polygon hikes up transaction fees, community not happyIn related news, Polygon increased transaction fees in a bid to prevent spam attacks on the system. However, holders are far from pleased, leaving the coin at risk of a steep correction. On-chain activity on the network is declining rapidly.
Over the past several days, daily network transactions almost dropped in half on average. Between October 3 and October 11, the number of transactions declined from six to three million. The substantial drop appears related to the recent gas price peak.
The post Polygon Matic at risk of collapse? appeared first on Invezz.
origin »Bitcoin price in Telegram @btc_price_every_hour
ETH/LINK Price Action Candlestick Set (LINKETHPA) на Currencies.ru
|
|


