2025-4-20 18:30 |
Bitcoin (BTC) is now one year past its most recent halving, and this cycle is shaping up to be unlike any before it. Unlike previous cycles where explosive rallies followed the halving, BTC has seen a far more muted gain, up just 31%, compared to 436% over the same timeframe in the last cycle.
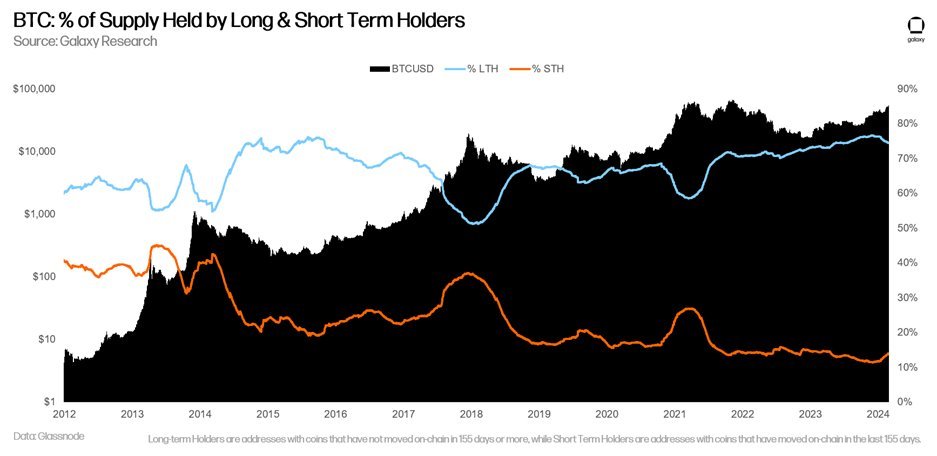
At the same time, long-term holder metrics like the MVRV ratio are signaling a sharp decline in unrealized profits, pointing to a maturing market with compressing upside. Together, these shifts suggest Bitcoin may be entering a new era, defined less by parabolic peaks and more by gradual, institution-driven growth.
A Year After the Bitcoin Halving: A Cycle Unlike Any OtherThis Bitcoin cycle is unfolding noticeably differently than previous ones, signaling a potential shift in how the market responds to halving events.
In earlier cycles—most notably from 2012 to 2016 and again from 2016 to 2020—Bitcoin tended to rally aggressively around this stage. The post-halving period was often marked by strong upward momentum and parabolic price action, largely fueled by retail enthusiasm and speculative demand.
The current cycle, however, has taken a different route. Instead of accelerating after the halving, the price surge began earlier, in October and December 2024, followed by consolidation in January 2025 and a correction in late February.
This front-loaded behavior diverges sharply from historical patterns where halvings typically acted as the catalyst for major rallies.
Several factors are contributing to this shift. Bitcoin is no longer just a retail-driven speculative asset—it’s increasingly seen as a maturing financial instrument. The growing involvement of institutional investors, coupled with macroeconomic pressures and structural changes in the market, has led to a more measured and complex response.
Bitcoin Cycles Comparison. Source: Bitcoin Cycles Comparison.Another clear sign of this evolution is the weakening strength of each successive cycle. The explosive gains of the early years have become harder to replicate as Bitcoin’s market cap has grown. For instance, in the 2020–2024 cycle, Bitcoin had climbed 436% one year after the halving.
In contrast, this cycle has seen a much more modest 31% increase over the same timeframe.
This shift could mean Bitcoin is entering a new chapter. One with less wild volatility and more steady, long-term growth. The halving may no longer be the main driver. Other forces are taking over—rates, liquidity, and institutional money.
The game is changing. And so is the way Bitcoin moves.
Nonetheless, it’s important to note that previous cycles also featured periods of consolidation and correction before resuming their uptrend. While this phase may feel slower or less exciting, it could still represent a healthy reset before the next move higher.
That said, the possibility remains that this cycle will continue to diverge from historical patterns. Instead of a dramatic blow-off top, the outcome may be a more prolonged and structurally supported uptrend—less driven by hype, more by fundamentals.
What Long-Term Holder MVRV Reveals About Bitcoin’s Maturing MarketThe Long-Term Holder (LTH) MVRV ratio has always been a solid measure of unrealized profits. It shows how much long-term investors are sitting on before they start selling. But over time, this number is falling.
In the 2016–2020 cycle, LTH MVRV peaked at 35.8. That signaled massive paper profits and a clear top forming. By the 2020–2024 cycle, the peak dropped sharply to 12.2. This happened even as Bitcoin price hit fresh all-time highs.
In the current cycle, the highest LTH MVRV so far is just 4.35. That’s a massive drop. It shows long-term holders aren’t seeing the same kind of gains. The trend is clear: each cycle delivers smaller multiples.
Bitcoin’s explosive upside is compressing. The market is maturing.
Now, in the current cycle, the highest LTH MVRV reading so far has been 4.35. This stark drop suggests long-term holders are experiencing much lower multiples on their holdings compared to previous cycles, even with substantial price appreciation. The pattern points to one conclusion: Bitcoin’s upside is compressing.
BTC Long-Term Holders MVRV. Source: Glassnode.This isn’t just a fluke. As the market matures, explosive gains are naturally harder to come by. The days of extreme, cycle-driven profit multiples may be fading, replaced by more moderate—but potentially more stable—growth.
A growing market cap means it takes exponentially more capital to move the price significantly.
Still, it’s not definitive proof that this cycle has already topped out. Previous cycles often included extended periods of sideways movement or modest pullbacks before new highs were reached.
With institutions playing a larger role, accumulation phases could stretch longer. Therefore, peak profit-taking may be less abrupt than in earlier cycles.
However, if the trend of declining MVRV peaks continues, it could reinforce the idea that Bitcoin is transitioning away from wild, cyclical surges and toward a more subdued but structured growth pattern.
The sharpest gains may already be behind, especially for those entering late in the cycle.
The post One Year After Bitcoin’s Latest Halving: Why This Cycle Looks Very Different appeared first on BeInCrypto.
origin »Bitcoin price in Telegram @btc_price_every_hour
Bitcoin (BTC) на Currencies.ru
|
|