2022-11-1 13:33 |
As the eyes of the crypto community turn to tomorrow’s Federal Reserve FOMC meeting, an on-chain analysis by Glassnode suggests that the bottom just needs to be hammered out.
In their weekly report, the firm states that a number of metrics are currently bouncing, making a relatively consistent argument that the bitcoin market has hit a bottom. In this regard, the current numbers are “almost textbook” comparable to previous cycle lows.
To back up the claim, Glassnode consults the Mayer Multiple and the Realized Price. The latter of the two metrics calculates the acquisition price per coin. This allows to determine whether the overall market shows an unrealized loss which is the case when the spot price is below the Realized Price.
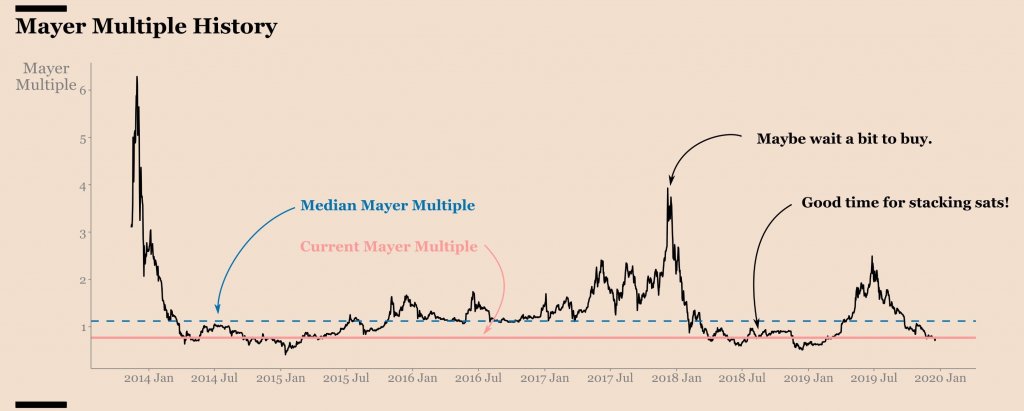
The Mayer Multiple helps assess overbought and underbought conditions. It plots the relationship between the BTC spot price and the 200-day Simple Moving Average. The latter is a model widely used in traditional financial analysis. Gassnode writes:
Remarkably, this pattern has repeated in the current bear market, with the June lows trading below both models for 35 days. The market is currently approaching the underside of the Realized Price at $21,111, where a break above would be a notable sign of strength.
Source: Glassnode Bitcoin Forming A Bottom Takes TimeA third metric considered by Glassnode, the Balanced Price is the difference between the Realized Price and the Transferred Price. The “fair value” model is currently hovering around $16,500.
As Glassnode notes, in past cycles the Bitcoin price moved in the range between the Realized Price and the Balanced Price for 5.5 and 10 months before a breakout occurred.
During the 2014 and 2015 bear market, the BTC price remained for 10 months in the range between the two metrics. Within the 2018/2019 bear, it was only 5.5 months. If history repeats, Bitcoin investors may want to expect a bear market to continue for a bit longer.
Source: GlassnodeAnother characteristic of a bottom formation is an ongoing change of Bitcoin owners. This behavior by investors can be analyzed by tracking the UTXO Realized Price Distribution (URPD). According to Glassnode, the proportion of supply that has changed hands so far is significant, but maybe not enough.
During the 2018-2019 bottoming period, about 22.7% of total supply moved in the range when the price first broke below the Realized Price and above that metric.
The same analysis for 2022 shows that only about 14.0% of supply has been redistributed in this range to date. Thus, this metric also suggests that “an additional phase of redistribution is needed” before a bottom is finally in.
However, at the same time, the research firm cautions that there is currently “no convincing influx of new demand.” Nevertheless, the company gives an optimistic outlook and claims:
It does not appear that the bear-to-bull transition has formed as yet, however, there does appear to be seeds planted in the ground.
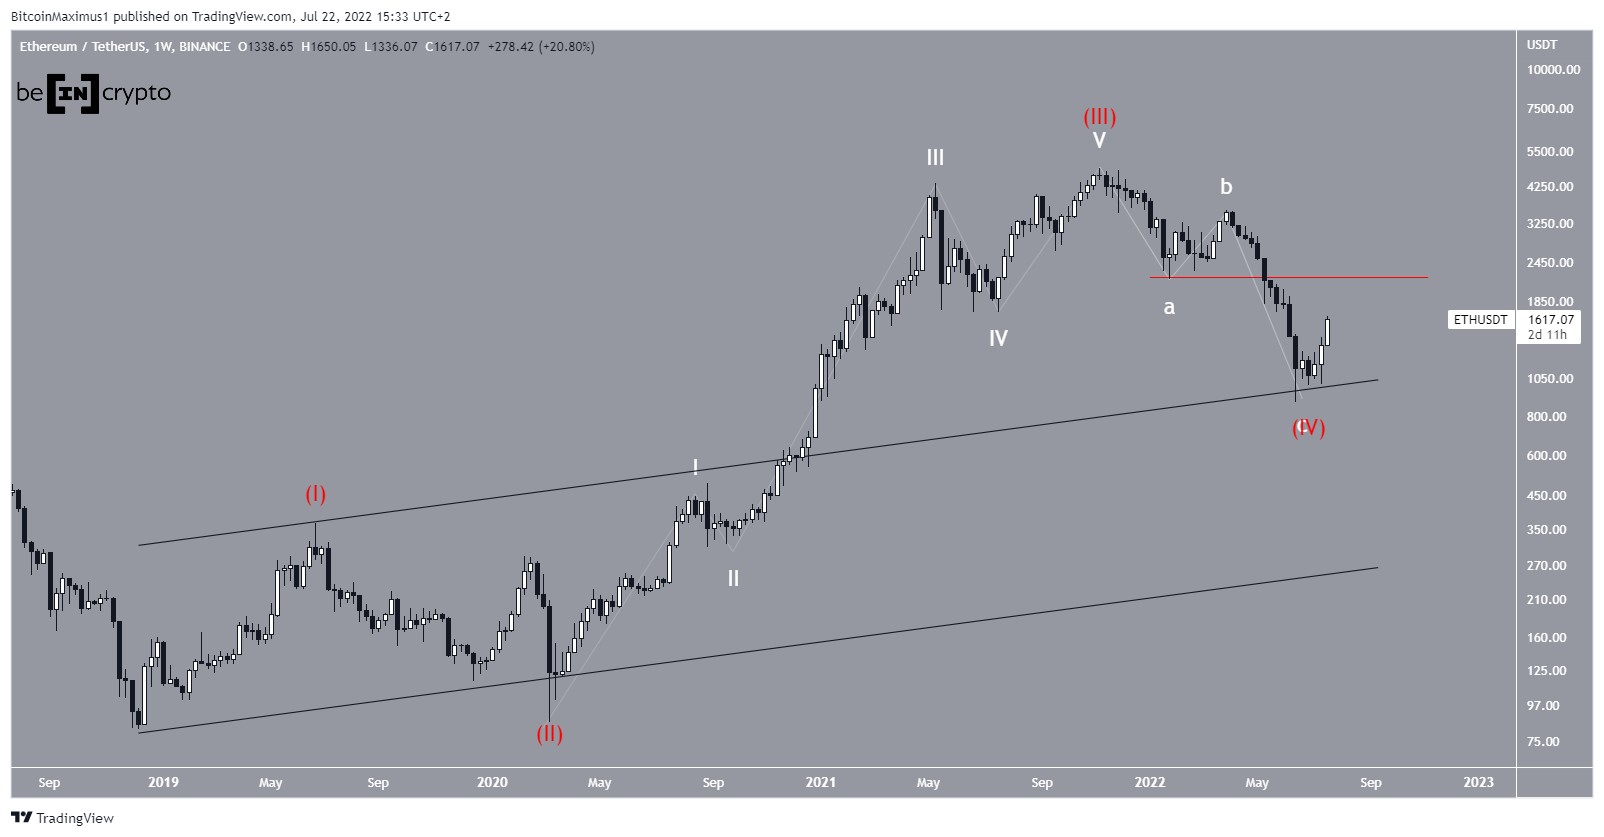
At the time of writing, BTC was trading at just over $20.6k and sat close to its 100-day moving average (green line). The 200 day MA sits currently at around $24,500 and thus remains a long way off.
Bitcoin close to the 100-day MA. Source: TradingView origin »Bitcoin price in Telegram @btc_price_every_hour
Bitcoin (BTC) на Currencies.ru
|
|