Sma - Свежие новости [ Фото в новостях ] | |

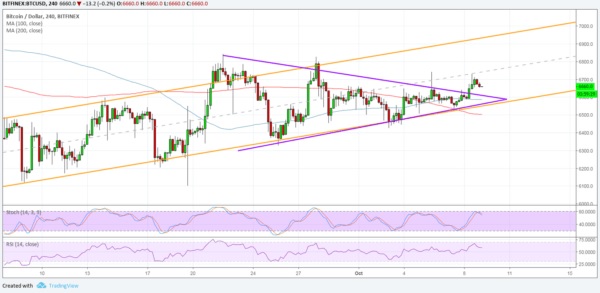
Биткоин всё ещё нацелен на «север»
Биткоин сделал ещё один небольшой прорыв на «север» от вершины малого треугольника, что указывает на его укрепление в краткосрочных временных рамках. Индикатор 100 SMA расположен выше более долгосрочного 200 SMA, таким образом, путь наименьшего сопротивления находится наверху. Другими словами, вероя... дальше »
2018-10-9 11:31 | |
|
|
MONERO (XMR) Daily Price Forecast – October 8
XMR/USD Medium-term Trend: Ranging Resistance Levels: $120. 75, $122. 75, $124. 75 Support Levels: $111. ,75 $1110. 75, $1109. 75 A notable Japanese bearish candlestick suddenly emerged during the trading sessions of the XMR/USD market yesterday. дальше »
2018-10-8 16:27 | |
|
|
IOTA (MIOTA) Daily Price Forecast – October 8
IOTA/USD Medium-term Trend: Ranging Resistance Levels: $0.60, $0.62, $0.64 Support Levels: $0.56, 0.55, $0.54 IOTA had initially made a bullish appearance but shortly after a few hours, it was grabbed by bears’ presence that pushed the market value southwards briefly past both the middle Bollinger Band and the 50-day SMA yesterday. A couple of hours […] дальше »
2018-10-8 14:54 | |
|
|
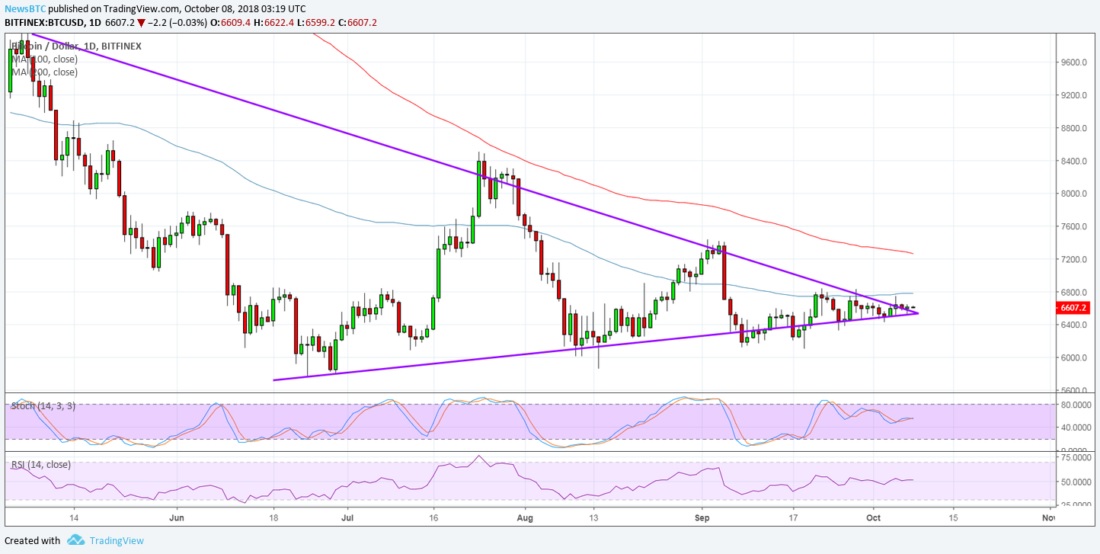
Bitcoin (BTC) Price Analysis: Bullish Breakout Finally Happening?
Bitcoin has been stuck inside its symmetrical triangle consolidation for quite some time now, but bulls seem to be getting the upper hand. Price is already closing above the triangle top to signal that a longer-term climb is underway. дальше »
2018-10-8 03:52 | |
|
|
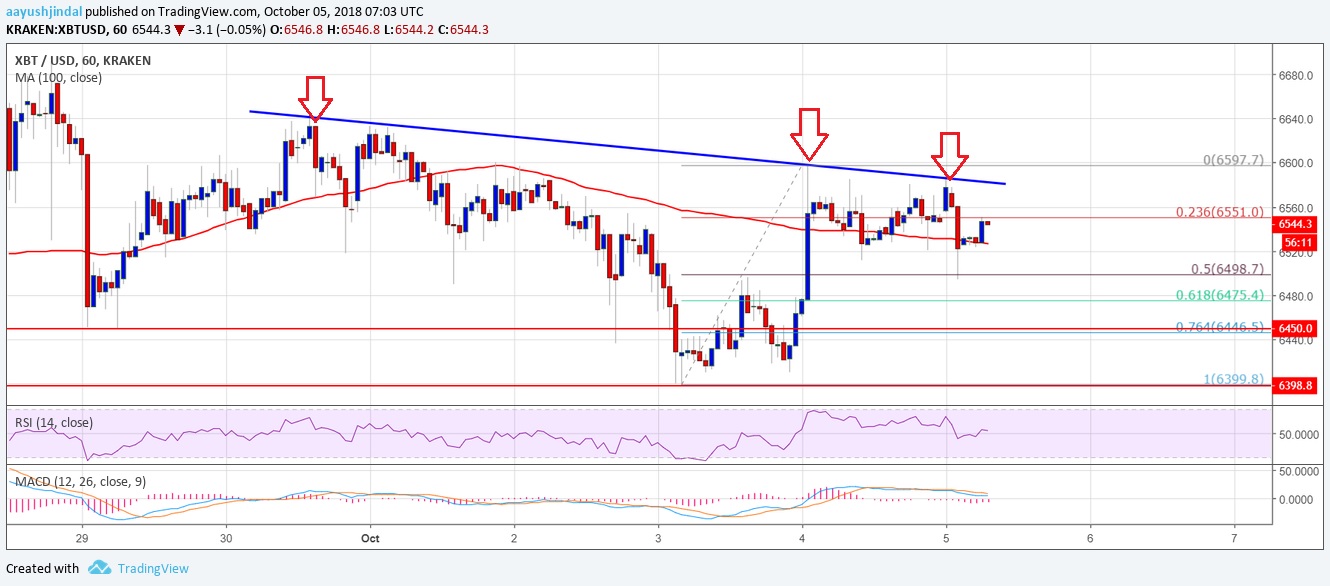
Обзор курса биткоина: Почему важно преодолеть уровень сопротивления в $6600
Цена биткоина изо всех сил пытается пройти уровень сопротивления в $6600, и неудачные попытки могут снова привести к нисходящему тренду. Курс биткоина по отношению к доллару уже неоднократно пытался преодолеть барьер в $6600 и $6580. дальше »
2018-10-5 14:41 | |
|
|
Binance Coin (BNB) Daily Price Forecast – October 3
BNB/USD Medium-term Trend: Bullish Distribution territories: $10. 8000000, $11. 000000, $11. 2000000 Accumulation territories: $9. 8000000, $9. 6000000, $9. 4000000 BNB/USD as at the beginning of trading hours yesterday moved frequently in a ranging style along both the middle Bollinger Band and the 50-day SMA. дальше »
2018-10-3 16:23 | |
|
|

Всем приготовиться: цена Эфириума готовится к новому скачку
Цена Эфириума сформировала симметричный треугольник на 1-часовом графике. Спустя несколько часов актив приблизится к вершине треугольника, откуда произойдёт резкий скачок цены. В какую сторону? На этот вопрос попытались ответить в NewsBTC. дальше »
2018-9-21 18:15 | |
|
|

Bitcoin Price Watch: BTC/USD Sets Eyes On $6,080
Key Points Bitcoin price declined slightly and settled below the $6,300 level against the US Dollar. There was a break below a short term triangle pattern with support at $6,320 on the hourly chart of the BTC/USD pair (data feed from Kraken). дальше »
2018-9-12 11:48 | |
|
|
«Бычье» настроение: Почему биткоин растёт и сколько это продолжится
Биткоин продолжает свой рост, и его курс образует нарастающий клин, что может вызвать прорыв вверх. Линия индикатора 100 SMA начинает пересекать более длинную 200 SMA, сигнализируя о том, что путь наименьшего сопротивления находится наверху. дальше »
2018-9-3 14:15 | |
|
|
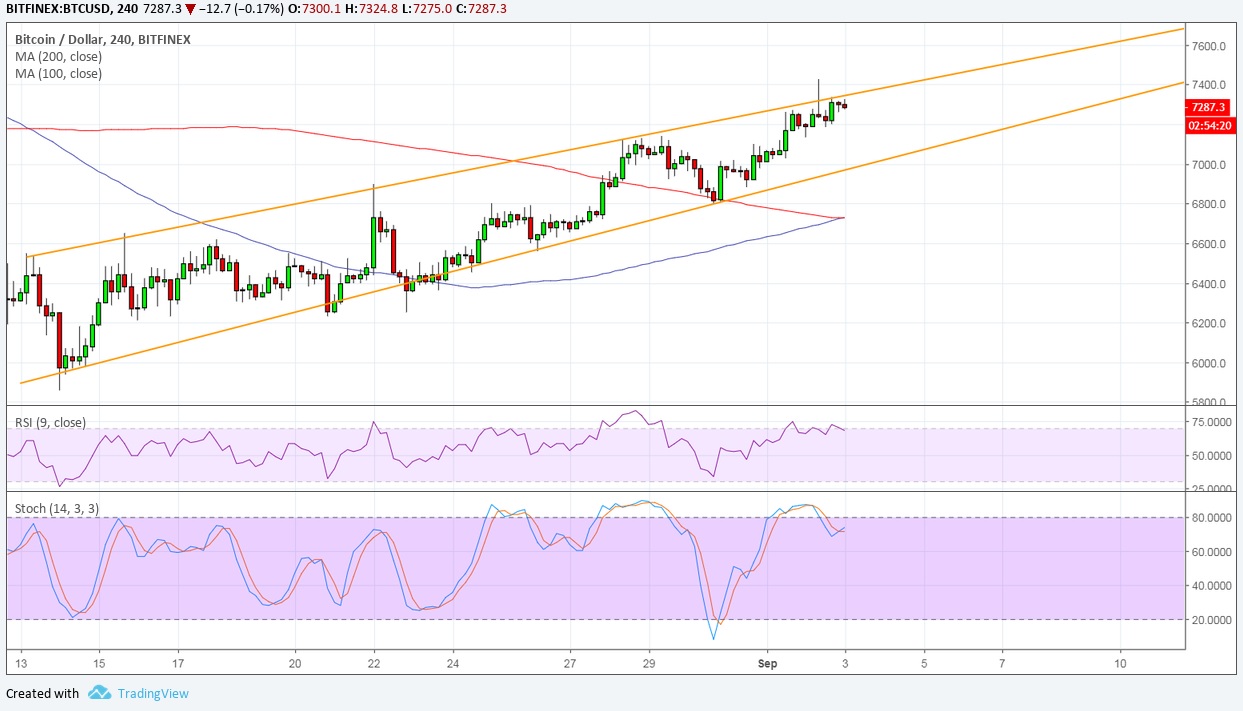
Bitcoin (BTC) Price Watch: Don’t Miss This Bullish Pullback
Bitcoin Price Key Highlights Bitcoin price is trending higher inside an ascending channel on the 4-hour chart and is testing the top. A pullback to support might be due from here, so as to gather more bullish energy on the climb. дальше »
2018-9-3 07:32 | |
|
|
Ripple Price Analysis: XRP/USD Turned Short-term Bullish above $0.2660
Key Highlights Ripple price corrected higher recently and broke the $0. 2660 and $0. 2800 resistances against the US dollar. There is a new connecting bearish trend line formed with resistance at $0. дальше »
2018-8-16 10:00 | |
|
|
Bitcoin (BTC) Price Watch: Aiming for Wedge Bottom?
Bitcoin Price Key Highlights Bitcoin price is on another day of declines, possibly setting its sights on longer-term support zones. Price has already closed below the 50 SMA to reflect a pickup in selling pressure. дальше »
2018-8-8 06:52 | |
|
|
Bitcoin Cash Price Analysis: Can BCH/USD Break Above 100 SMA?
Key Points Bitcoin cash price is slowly declining and is currently well below $830 against the US Dollar. Yesterday’s highlighted important bearish trend line is intact with resistance near $825 on the hourly chart of the BCH/USD pair (data feed from Kraken). дальше »
2018-7-31 07:08 | |
|
|
Ethereum Price Analysis: ETH/USD Broke Key Support and 100 SMA
Key Highlights ETH price declined recently and broke a key support near $468 against the US Dollar. Yesterday’s highlighted important bullish trend line was breached with support at $476 on the hourly chart of ETH/USD (data feed via Kraken). дальше »
2018-7-27 08:00 | |
|
|
Bitcoin (BTC) Price Watch: Bulls Keep Charging, Where to Next?
Bitcoin Price Key Highlights Bitcoin seems unstoppable in its climb as it sets its sights on the next upside targets. Price is on its way to test the dynamic resistance at the 200 SMA inflection point then the $9,000 area of interest. дальше »
2018-7-25 06:48 | |
|
|
Ethereum Price Analysis: Can ETH/USD Hold 100 SMA?
Key Highlights ETH price started a major downside correction below the $500 level against the US Dollar. This week’s highlighted key bullish trend line was breached with support at $485 on the hourly chart of ETH/USD (data feed via Kraken). дальше »
2018-7-19 08:00 | |
|
|
Bitcoin Cash Price Analysis: Can BCH/USD Break 100 SMA?
Key Points Bitcoin cash price declined further, but it found support near the $660 level against the US Dollar. This week’s highlighted key bearish trend line is still in place with current resistance near $718 on the hourly chart of the BCH/USD pair (data feed from Kraken). дальше »
2018-7-13 07:08 | |
|
|
Ethereum Price Analysis: ETH/USD Holding 100 SMA
Key Highlights ETH price failed once again around the $482-484 resistance and declined against the US Dollar. There is a major bullish trend line formed with support at $454 on the hourly chart of ETH/USD (data feed via Kraken). дальше »
2018-7-5 08:00 | |
|
|
Ethereum Price Analysis: ETH/USD Struggling Near 100 SMA
Key Highlights ETH price moved above the $448 resistance and tested the $470 zone against the US Dollar. There was a break above yesterday’s highlighted important bearish trend line with resistance at $448 on the hourly chart of ETH/USD (data feed via Kraken). дальше »
2018-6-26 08:00 | |
|
|

Monero Expected To Breakout Soon
As it builds into a triangle like pattern, Monero is expected to be soon ready for a breakout soon. As you can see from the chart below, the open-source cryptocurrency is currently developing inside a balanced triangle pattern and is nearing its peak which is a sign that it could breakout any minute now. дальше »
2018-6-25 23:00 | |
|
|
Bitcoin Price Watch: Can BTC/USD Break 100 SMA?
Key Points Bitcoin price formed a decent support near the $6,130 level and recovered against the US Dollar. The BTC/USD pair is currently attempting to break a key bearish trend line with resistance at $6,450 on the hourly chart (data feed from Kraken). дальше »
2018-6-14 11:00 | |
|
|