Chart - Свежие новости [ Фото в новостях ] | |

Why Bitcoin's latest milestone may do little to support BTC bulls
Bitcoin bulls flex as whole coiners and long-term holders rally. BTC’s price chart showed signs that the market might be kicking off its next short-term rally If you are a Bitcoin [BTC] faThe post Why Bitcoin's latest milestone may do little to support BTC bulls appeared first on AMBCrypto. дальше »
2023-9-29 04:30 | |
|
|

XRP Price Analysis: 4-Month Chart Dynamics Decoded By Crypto Analyst
In a recent tweet, renowned crypto analyst, EGRAG CRYPTO, unveiled an intricate 4-month XRP price analysis which presented various crucial insights and predictions. This was encapsulated in his words: “XRP Steel Foundation & Eye-Opening Insights: Behold the chart below, crafted from 4-month candles, revealing that higher time frames are less susceptible to deceptive signals. дальше »
2023-9-27 12:35 | |
|
|
Bitcoin Price Up 30% Versus Ethereum, New 2023 Lows Incoming?
Bitcoin price is up 30% versus Ethereum (ETH) in 2023, and bulls appear not to be slowing down, looking at the performance in the weekly chart. BTC is on the brink of pushing ETH lower at spot rates, registering new 2023 lows and extending gains from early this year. дальше »
2023-9-27 04:00 | |
|
|

CURVE DAO PRICE ANALYSIS & PREDICTION (September 25) – CRV Gains 8% Overnight Amid Bearish Trend, What Happened?
CRV saw notable gains in the past few days following a recent recovery in the global market cap. However, its mid-term bearish trajectory is still intact. It leads the top-gainer chart with an 18% increase in the past 7 days. дальше »
2023-9-26 10:41 | |
|
|
Assessing whether TRX can exit its sideways path anytime soon
Apart from TVL, Tron’s daily active addresses also increased. Though TRX’s weekly chart was green, market indicators turned bearish. Tron’s [TRX] DeFi space recently witnessed a boost The post Assessing whether TRX can exit its sideways path anytime soon appeared first on AMBCrypto. дальше »
2023-9-25 01:30 | |
|
|
Fading bullish tide: ANKR/USDT signals a timing opportunity to sell
ANKR/USDT chart and technical analysis ANKR/USDT is retesting the major resistance level of 0. 02056 after it dropped significantly in the last couple of months. Price will possibly continue its bearish trend from this level as this has been a strong resistance level in the past. дальше »
2023-9-23 15:53 | |
|
|
Will Shiba Inu’s rising adoption help the memecoin surge in 2024?
Shibarium’s total wallets and addresses continued to rise. SHIB’s weekly chart was red, but metrics looked bullish. Shiba Inu [SHIB] has witnessed an increase in adoption since the bThe post Will Shiba Inu’s rising adoption help the memecoin surge in 2024? appeared first on AMBCrypto. дальше »
2023-9-23 13:30 | |
|
|
This Bitcoin Chart Mirrors Sinister 2019 Shadow: Retrace To $20,000 On The Horizon?
Bitcoin (BTC), the largest cryptocurrency by market capitalization, has faced a setback in its recent gains after failing to consolidate above the $27,000 level. With no positive macro news to drive BTC beyond upper resistance lines, industry experts are looking for a chart analysis that suggests BTC may be on the verge of a significant move toward $20,000. дальше »
2023-9-23 20:00 | |
|
|
MKR/USDT’s soaring potential: A buying opportunity at hand
MKR/USDT chart and technical analysis Maker tether is recovering from a months-long bearish trend and the market structure is turning bullish after the price made consecutive higher highs. Recently price retested the major daily supply area of $136,5 and currently, it is making a downward correction and preparing to jump to a new high. дальше »
2023-9-23 14:27 | |
|
|
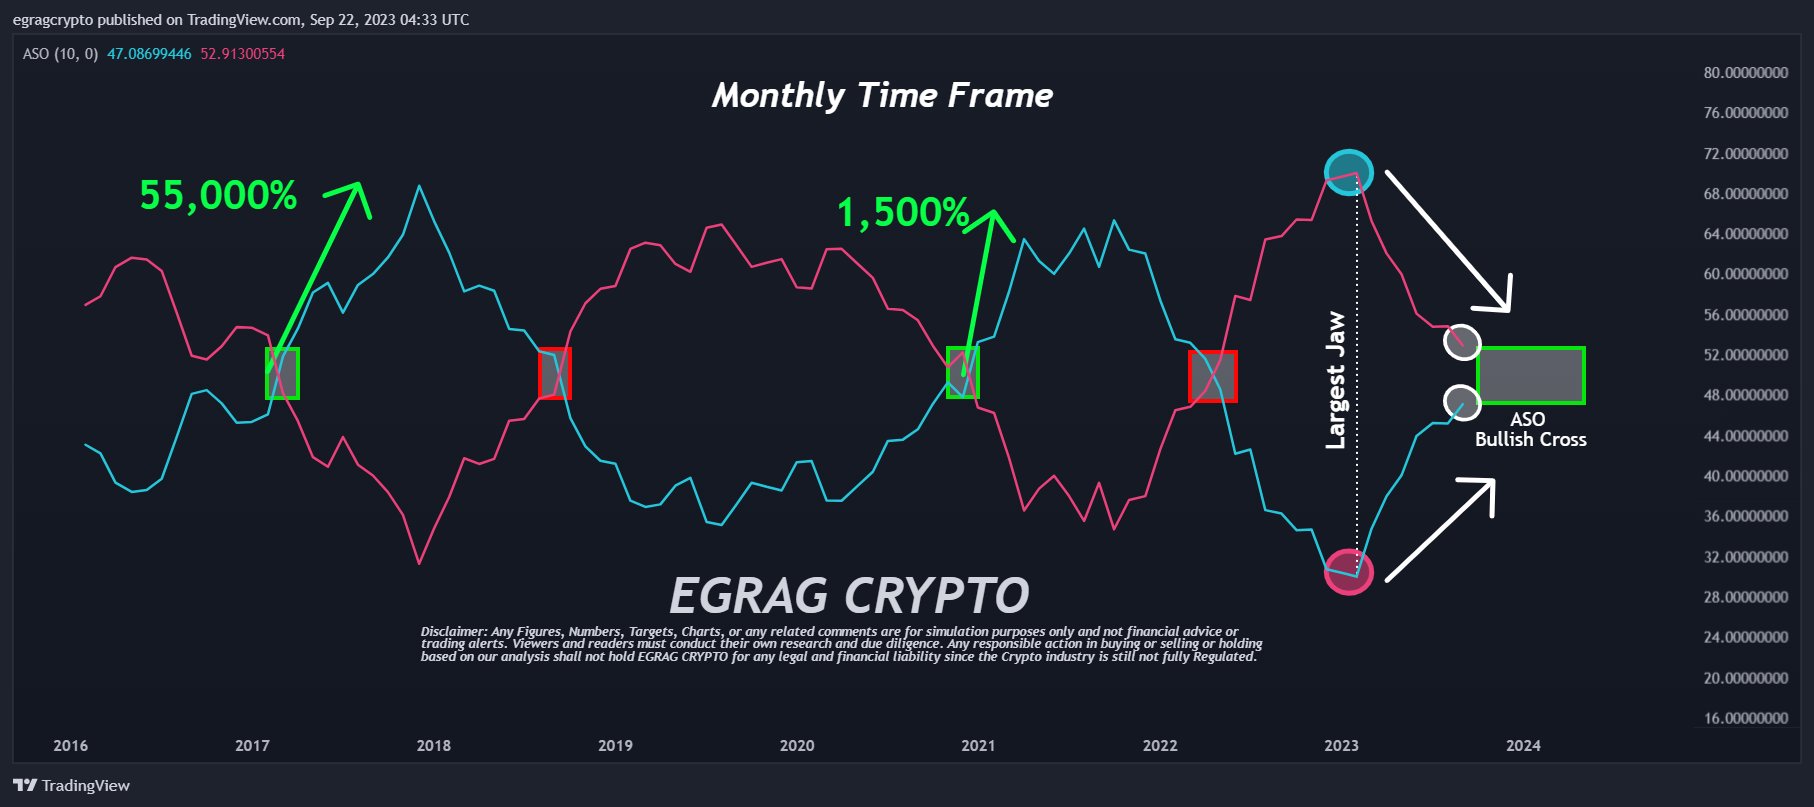
ASO Bullish Cross Reveals Bull Run Start For XRP: Crypto Analyst
Renowned crypto analyst EGRAG Crypto has unveiled a fresh XRP price prediction, introducing the community to a less-known indicator, the “Average Sentiment Oscillator” or ASO. Commenting on its significance, EGRAG explained on Twitter today: “Exciting ASO Update Alert! Check out the post from September 9th to witness the impressive ascent and curve of the bullish trend! The momentum is ablaze, with an unstoppable surge toward that coveted bullish cross! #XRPArmy, HOLD STEADY! The imminent ASO bullish cross is the spark that will ignite the upcoming XRP bull run!” Here’s When The Next XRP Bull Run Could Start From the chart presented by EGRAG, the convergence of the blue line (representing bulls) and the red line (representing bears) is evident. дальше »
2023-9-22 11:20 | |
|
|
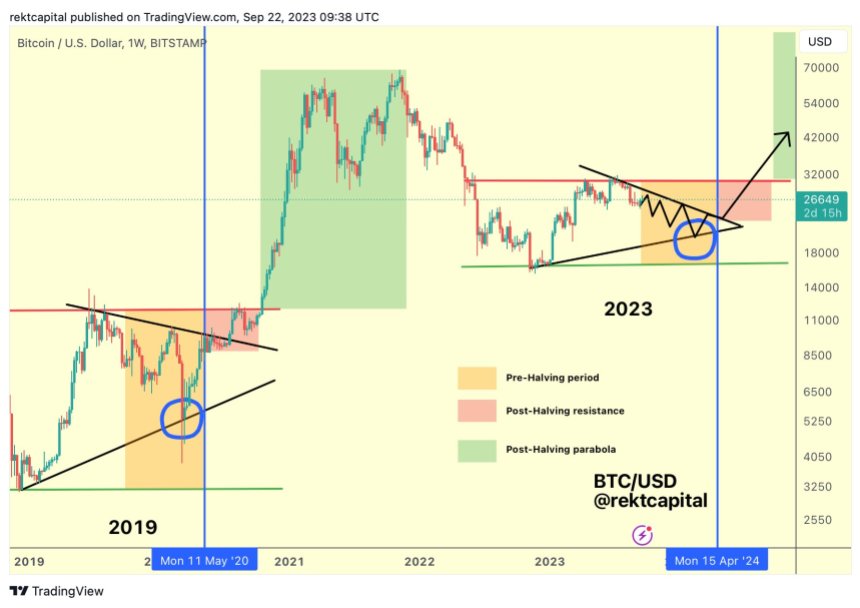
Beware the predictive power of Bitcoin halvings
The fourth Bitcoin halving will occur in April 2024 Previous halvings have preceded sharp price rises There are other factors at play, however, meaning caution should be taken when assuming that halvings for predictive power Before we get to the heart of this piece, let us present a chart. дальше »
2023-9-22 17:43 | |
|
|
Buy LTC/USDT opportunity: riding the upward momentum in Litecoin
LTC/USDT chart and technical analysis LTC/USDT is turning bullish after the price made inverse head and shoulder pattern and closed above the major resistance level of 63. 01. Price is making correction after it closed above the previous high. дальше »
2023-9-22 19:32 | |
|
|
What Top Crypto Analysts Are Saying About Ripple (XRP) Chart Patterns
The XRP price trend will maintain its bearish status unless it manages to achieve a closing value above $0.56. The post What Top Crypto Analysts Are Saying About Ripple (XRP) Chart Patterns appeared first on BeInCrypto. дальше »
2023-9-21 19:30 | |
|
|
Jasmy Coin price descending triangle points to more downside
Jasmy price has formed a descending triangle pattern on the daily chart. Focus now shifts to the upcoming Federal Reserve interest rate decision. Jasmy coin price has moved sideways in the past few days even as other cryptocurrencies have bounded back. дальше »
2023-9-20 17:59 | |
|
|
Shiba Inu Gearing Up For A 60% Surge? Key Indicators To Watch
Shiba Inu (SHIB) continues to be in a pivotal make-or-break moment. As described in our last in-depth price analysis of SHIB, two chart patterns on the 1-week chart could continue to determine the future of SHIB price, and their outlooks could not be more different. дальше »
2023-9-19 13:30 | |
|
|
XRP Price Flashes Bearish Death Cross, How Low Can It Go?
Death crosses appearing in the chart of any digital asset can be bad and the XRP price is no different in this regard. The token presently looks to be heading toward another notable drop in price as an analyst points out a looming death cross. дальше »
2023-9-19 02:00 | |
|
|
Here's what Bitcoin's diamond hands are up to in the short-term
There are still no signs of long-term holders' capitulation on the NUPL chart LTH supply and STH supply sharply diverged in 2023 Bitcoin [BTC] has received unflinching support from long-termThe post Here's what Bitcoin's diamond hands are up to in the short-term appeared first on AMBCrypto. дальше »
2023-9-18 16:00 | |
|
|
Binance coin (BNB) signals buy opportunity against USDT
BNB/USDT chart and technical analysis BNB/USDT is recovering from the major drop in the last couple of months. Price is indicating a bullish trend in making. The appearance of a bullish head and shoulder pattern is a clear indication of the coming uptrend. дальше »
2023-9-17 16:51 | |
|
|
Solana: Can sellers hijack SOL's latest recovery?
Disclaimer: The information presented does not constitute financial, investment, trading, or other types of advice and is solely the writer’s opinion The daily chart market structure was bearisThe post Solana: Can sellers hijack SOL's latest recovery? appeared first on AMBCrypto. дальше »
2023-9-15 06:30 | |
|
|
BTC buy signal: key Bitcoin resistance level turned into support
BTC/USD chart and technical analysis Bitcoin recently made a significant rally and closed above the major resistance level of $25,891. This level will now act as a strong support level. Price has been ranging for the last couple of weeks until the recent rally and it will possibly once again retest the $25,891 support level […] The post BTC buy signal: key Bitcoin resistance level turned into support appeared first on Invezz. дальше »
2023-9-15 16:21 | |
|
|
CCIP launch sparks development frenzy on Chainlink network
Development activity on Chainlink has grown since its CCIP mainnet launch. Key momentum indicators on the daily chart hinted at a good period to accumulate LINK. Development activity on leadThe post CCIP launch sparks development frenzy on Chainlink network appeared first on AMBCrypto. дальше »
2023-9-13 22:30 | |
|
|
An Indicator Signals “Buy” On the Bitcoin Weekly Chart, But BTC Needs to Get to This Level
According to Ali, a well-known crypto trader, this week is significant for Bitcoin due to key financial events. Ali points out that the TD Sequential indicator, a tool commonly used for identifying market reversals, has signaled a ‘buy’ on Bitcoin’s weekly chart. дальше »
2023-9-13 11:00 | |
|
|
Shiba Inu Hits Make-Or-Break Price: 250% Rally Or New All-Time Low?
Shiba Inu (SHIB) is in a crucial make-or-break moment. Following a market-wide altcoin slump, SHIB’s price action is being shaped by two opposing chart patterns, both of which could have significant implications for the price’s future. дальше »
2023-9-12 13:15 | |
|
|
Bitcoin Flash Crashes To New H2 2023 Lows, $20,000 Incoming?
Bitcoin, the world’s most valuable cryptocurrency, is free-falling, looking at price action on September 11. From the daily chart, BTC is trading at $25,135, a marginal improvement after dropping to H2 2023 lows of $24,951 minutes earlier following an unexpected dump in the early trading hours of the New York trading session. дальше »
2023-9-12 01:00 | |
|
|
Ripple’s XRP Soon to Make a ‘Gigantic Move,’ According to Top Crypto Analyst
Renowned crypto analyst Crypto Rover recently tweeted that Ripple’s XRP is on the verge of a major bullish move, stating it is gearing up for a ‘gigantic move. ’ The tweet was accompanied by a chart that further illustrated his point. дальше »
2023-9-10 19:06 | |
|
|
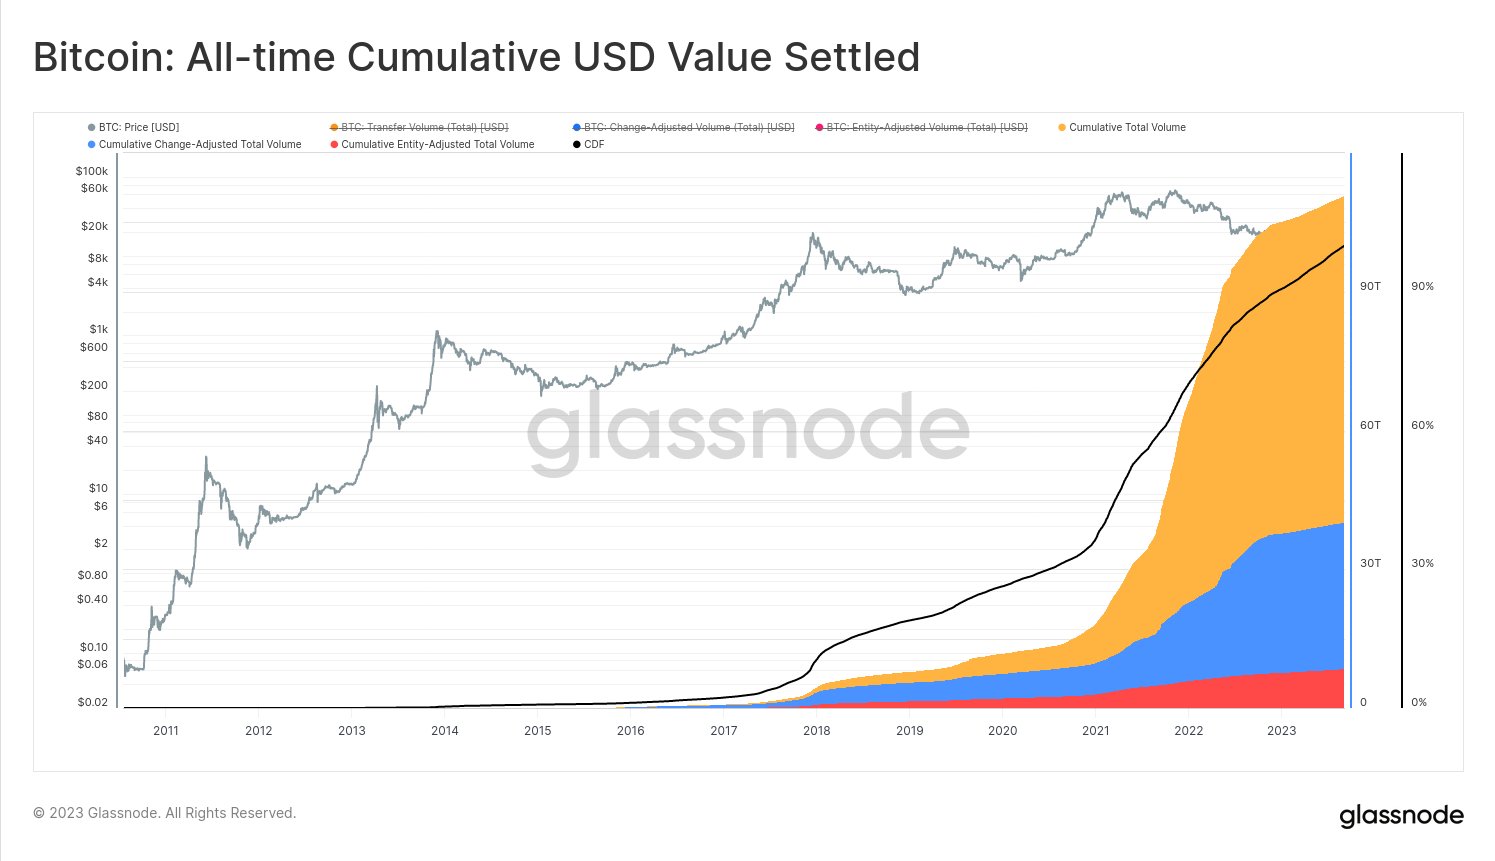
By The Numbers: How Much Volume Has Bitcoin Settled In Its Lifetime?
Here’s, in numbers, how much transaction volume the Bitcoin network has handled in total during its entire history so far. Bitcoin Total Cumulative Volume According To Three Different Models In a new post on X, the lead on-chain analyst at Glassnode, @_Checkmatey_, has shared a chart that assesses the total transaction volume that Bitcoin has […] дальше »
2023-9-9 00:30 | |
|
|
XLM Surges With 10% Rally – Can The Recovery Hold Its Ground?
Stellar (XLM) has experienced a robust resurgence, bouncing off a crucial support level at $0. 11. Chart indicators are pointing towards a promising outlook for bullish investors, marking a significant shift in momentum since mid-August. дальше »
2023-9-8 18:30 | |
|
|
Riot, MARA, Argo Blockchain stocks at risk as BTC forms death cross
Bitcoin mining stocks have dropped sharply from their highest levels this year. Bitcoin price is about to form a death cross pattern on the daily chart. The US dollar index is forming a golden cross pattern. дальше »
2023-9-8 18:45 | |
|
|
This Ethereum (ETH) Chart Unveils Unique Upside Potential
The ETH/USD chart is bearish while the ETH/BTC chart turns bullish.
The post This Ethereum (ETH) Chart Unveils Unique Upside Potential appeared first on BeInCrypto.
дальше »2023-9-7 12:17 | |
|
|
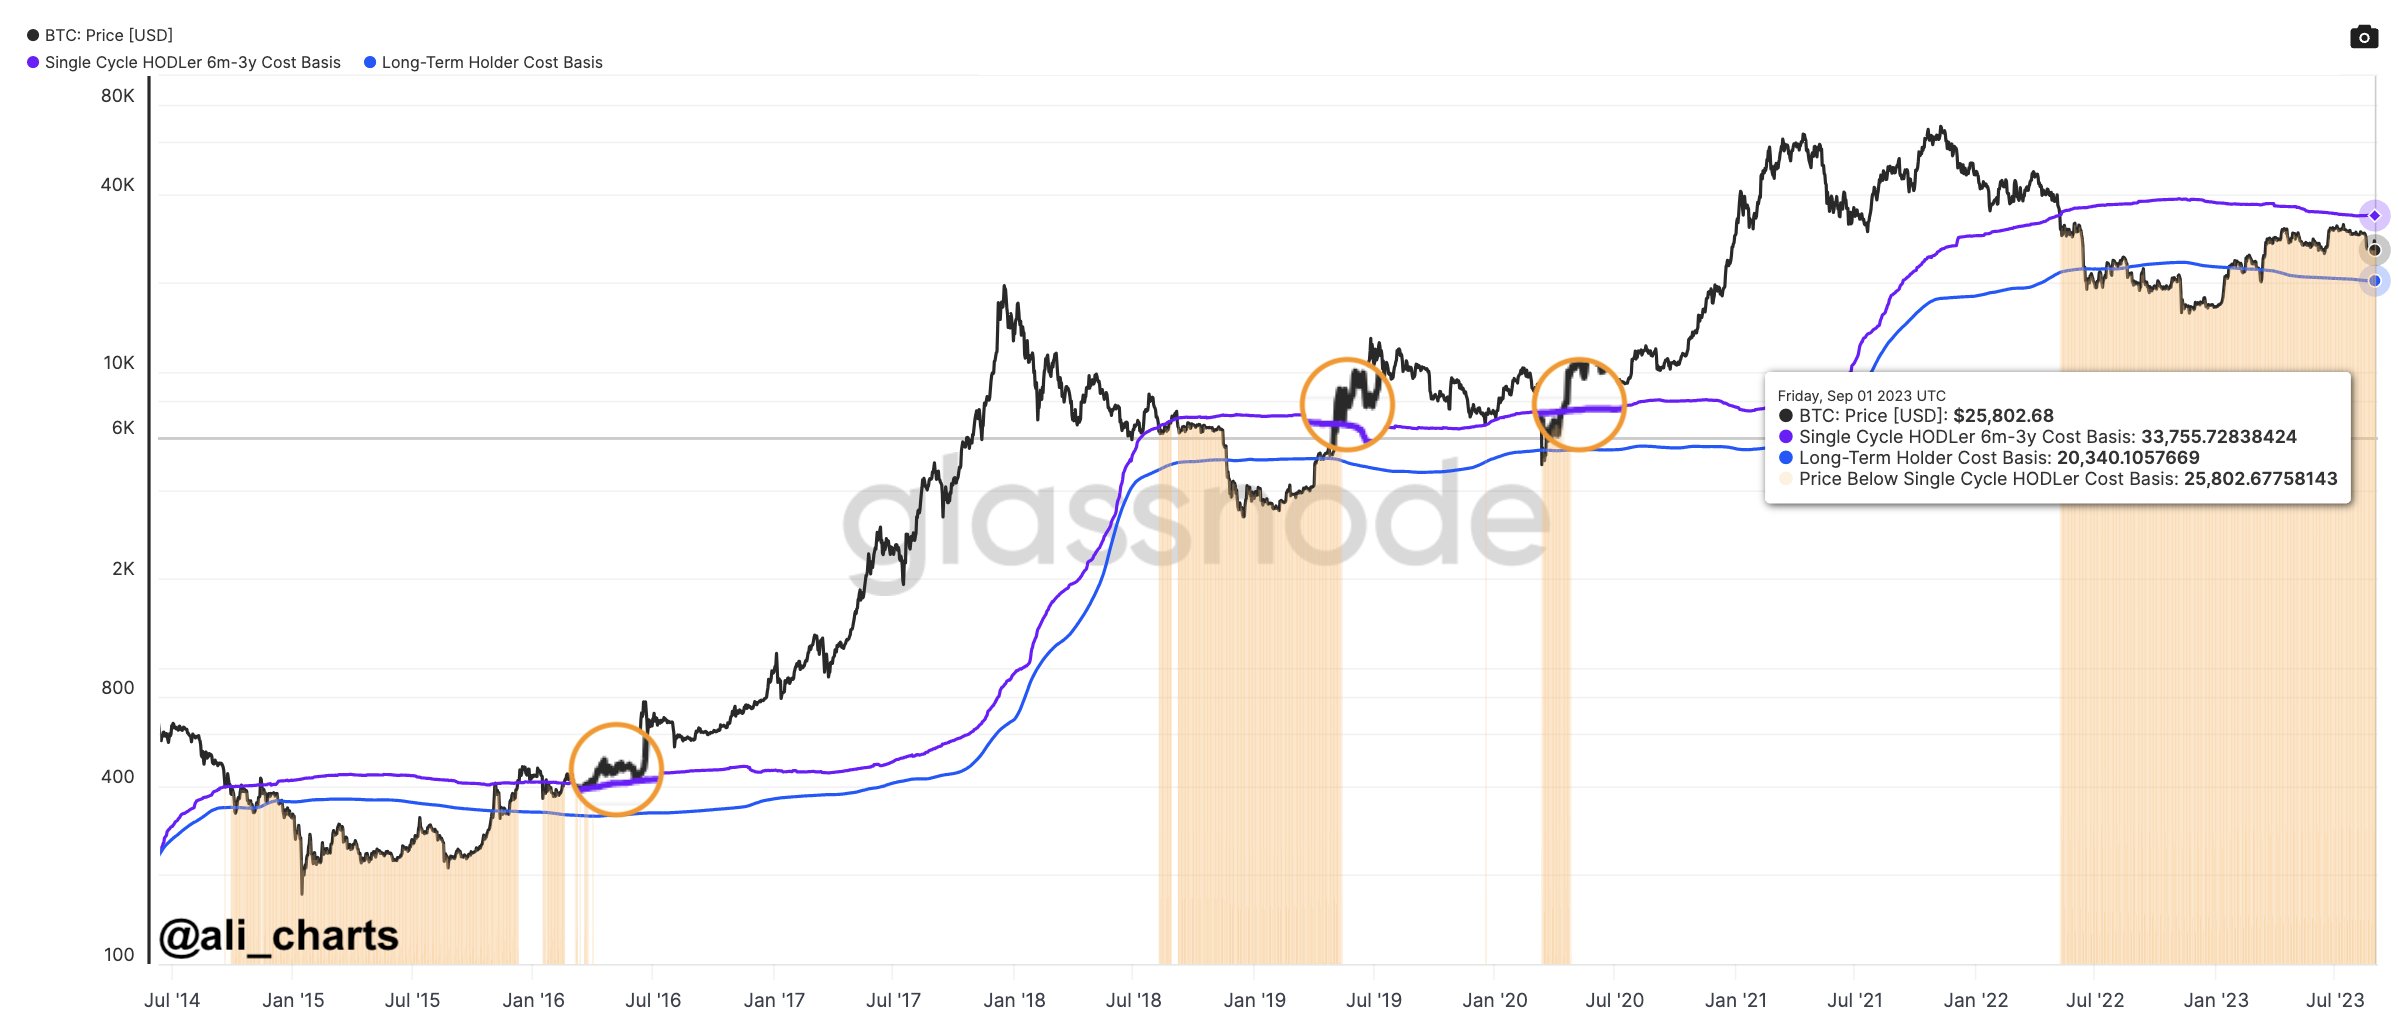
Here’s What Will Happen If Bitcoin Can Break $33,700
On-chain data suggests the $33,700 level could be a very significant level to break for Bitcoin if the historical pattern is anything to go by. Bitcoin 6 Months To 3 Years Old Investors Have $33,700 As Cost Basis In a new post on X, Ali, an analyst, has shared a chart that could shed light on the path that BTC may end up taking. дальше »
2023-9-6 20:00 | |
|
|

JOE Traders Set Sights on $0.6 Following Successful Resistance Flip
JOE has recently flipped the $0. 3 resistance level into a robust support on its 1-day (1D) chart. For traders and investors, this signals a strong bullish undertone. Flipping a resistance level into support is often seen as a milestone, indicative of a potential trend reversal. дальше »
2023-9-1 13:30 | |
|
|

Polkadot price: bearish outlook as DOT nears key support zone
Polkadot’s native token DOT has traded mostly lower since peaking around $7. 89 in February. Now bulls find themselves once again near a key horizontal support zone, a likely scenario given price is currently printing a second red candle on the daily chart as sellers eye break to $4. дальше »
2023-9-1 17:45 | |
|
|
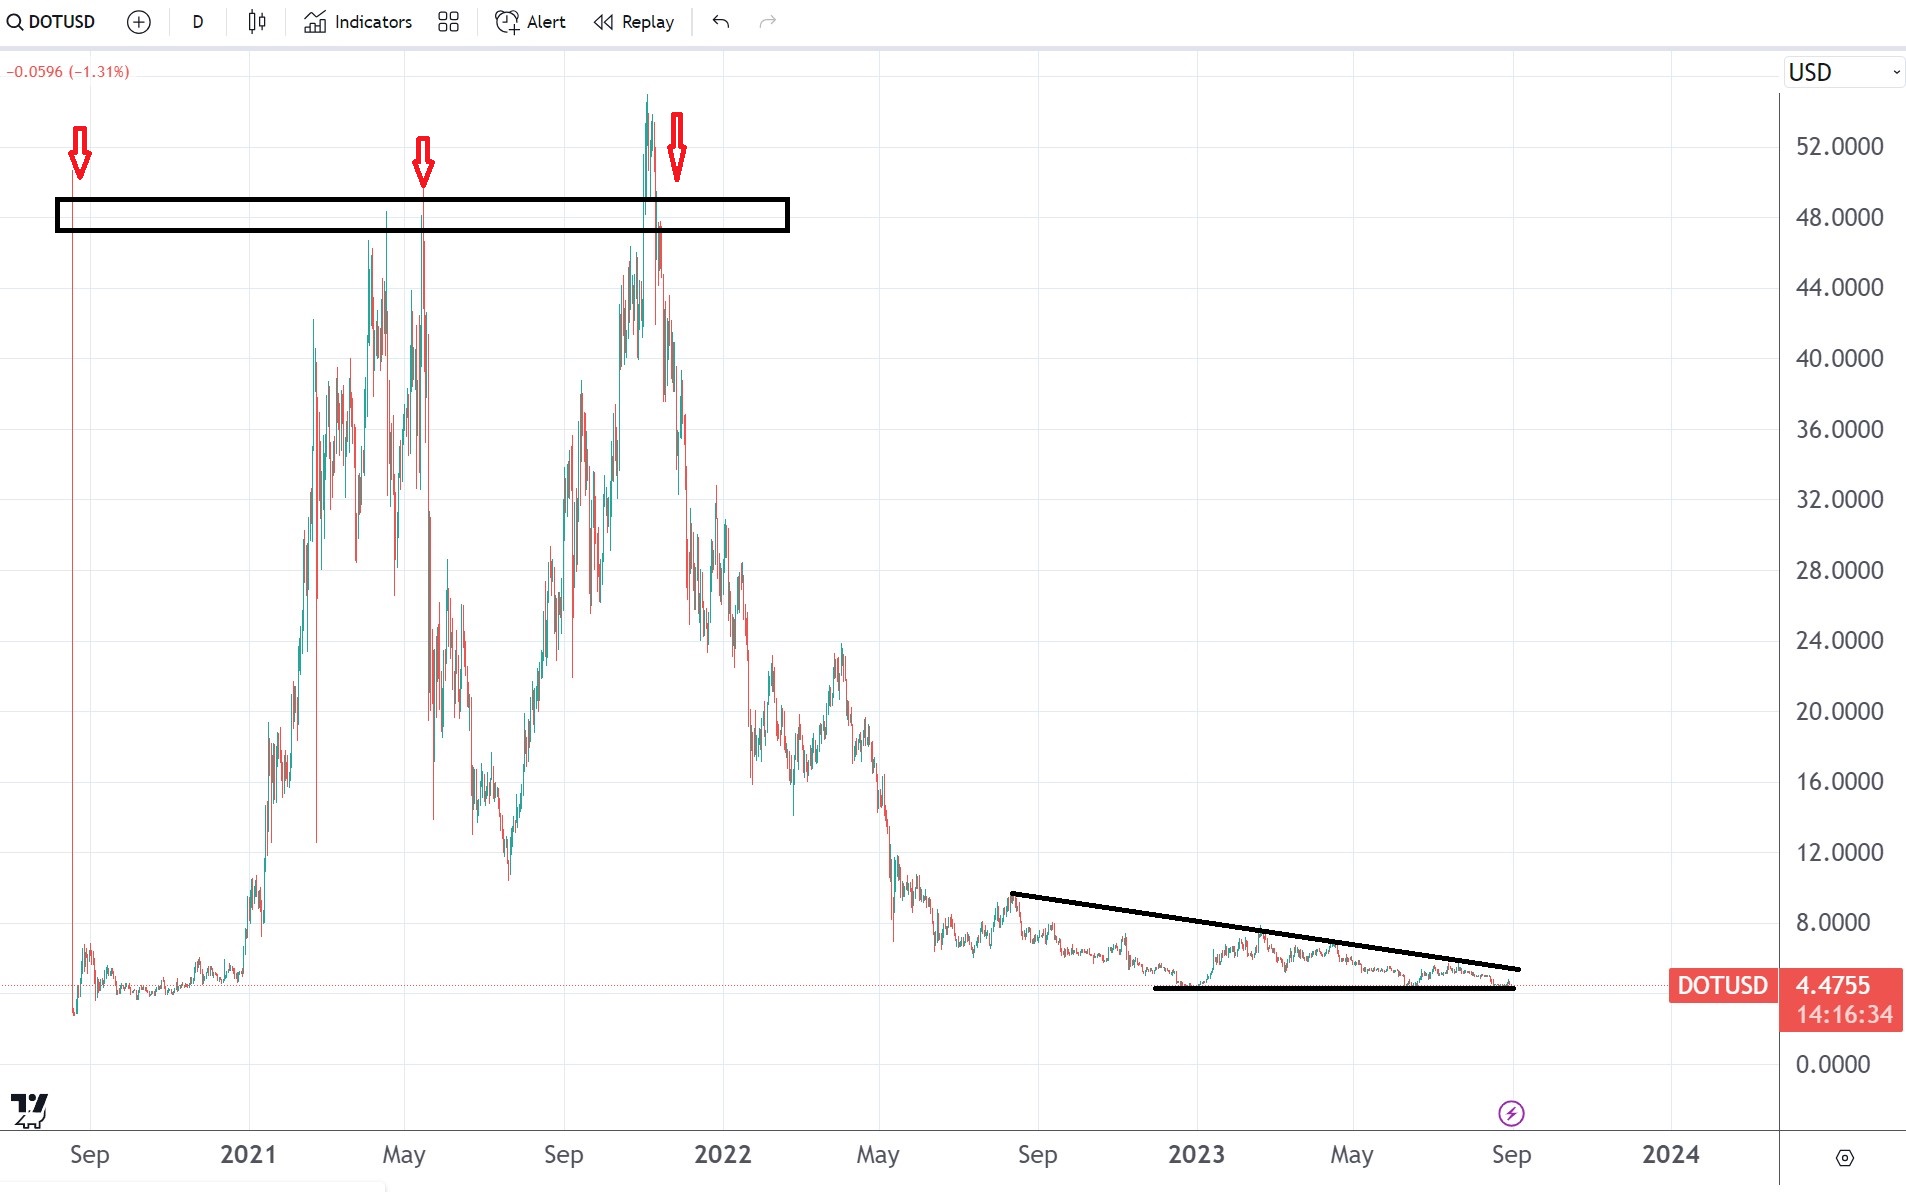
DOT/USD price forecast: A descending triangle keeps bulls at bay
DOT/USD is in a triangular consolidation The bias remains bearish Conservative traders might want to wait for the market to move first There is nothing positive in the DOT/USD chart for bulls. The price action remains constrained by a triangular pattern that formed in the last twelve months. дальше »
2023-8-31 13:00 | |
|
|
Fetch.ai (FET) Trading Pattern Reveals Potential for $4.45 – But There’s a Catch
Crypto enthusiasts have lately been buzzing about Fetch. ai ($FET), a decentralized machine learning platform that has been showing some strong indicators on its trading charts. After forming a double bottom pattern on the daily chart and flipping its 200-day exponential moving average (200EMA), $FET is now positioned for a short-term price target between $0. дальше »
2023-8-31 12:00 | |
|
|

Bitcoin metric with ‘100% long hit rate’ predicts $23K BTC price floor
Bitcoin chart signals are pointing to an incoming macro bottom level, according to a BTC price metric with a flawless history.
дальше »2023-8-29 16:46 | |
|
|
As Polygon awaits PIP approval, MATIC gets back on track
Sandeep Nailwal pointed out the benefits POL will bring if the PIP gets approved. MATIC’s daily chart turned green, and a few metrics were bullish. Over the last month, Polygon [MATIC]The post As Polygon awaits PIP approval, MATIC gets back on track appeared first on AMBCrypto. дальше »
2023-8-29 13:30 | |
|
|
Chainlink: How the latest update can affect Link prices
LINK was down by more than 4% in the last seven days. Selling pressure on Chainlink was high, but a few indicators looked bullish. Like most cryptos, Chainlink’s [LINK] price chart remThe post Chainlink: How the latest update can affect Link prices appeared first on AMBCrypto. дальше »
2023-8-29 04:30 | |
|
|
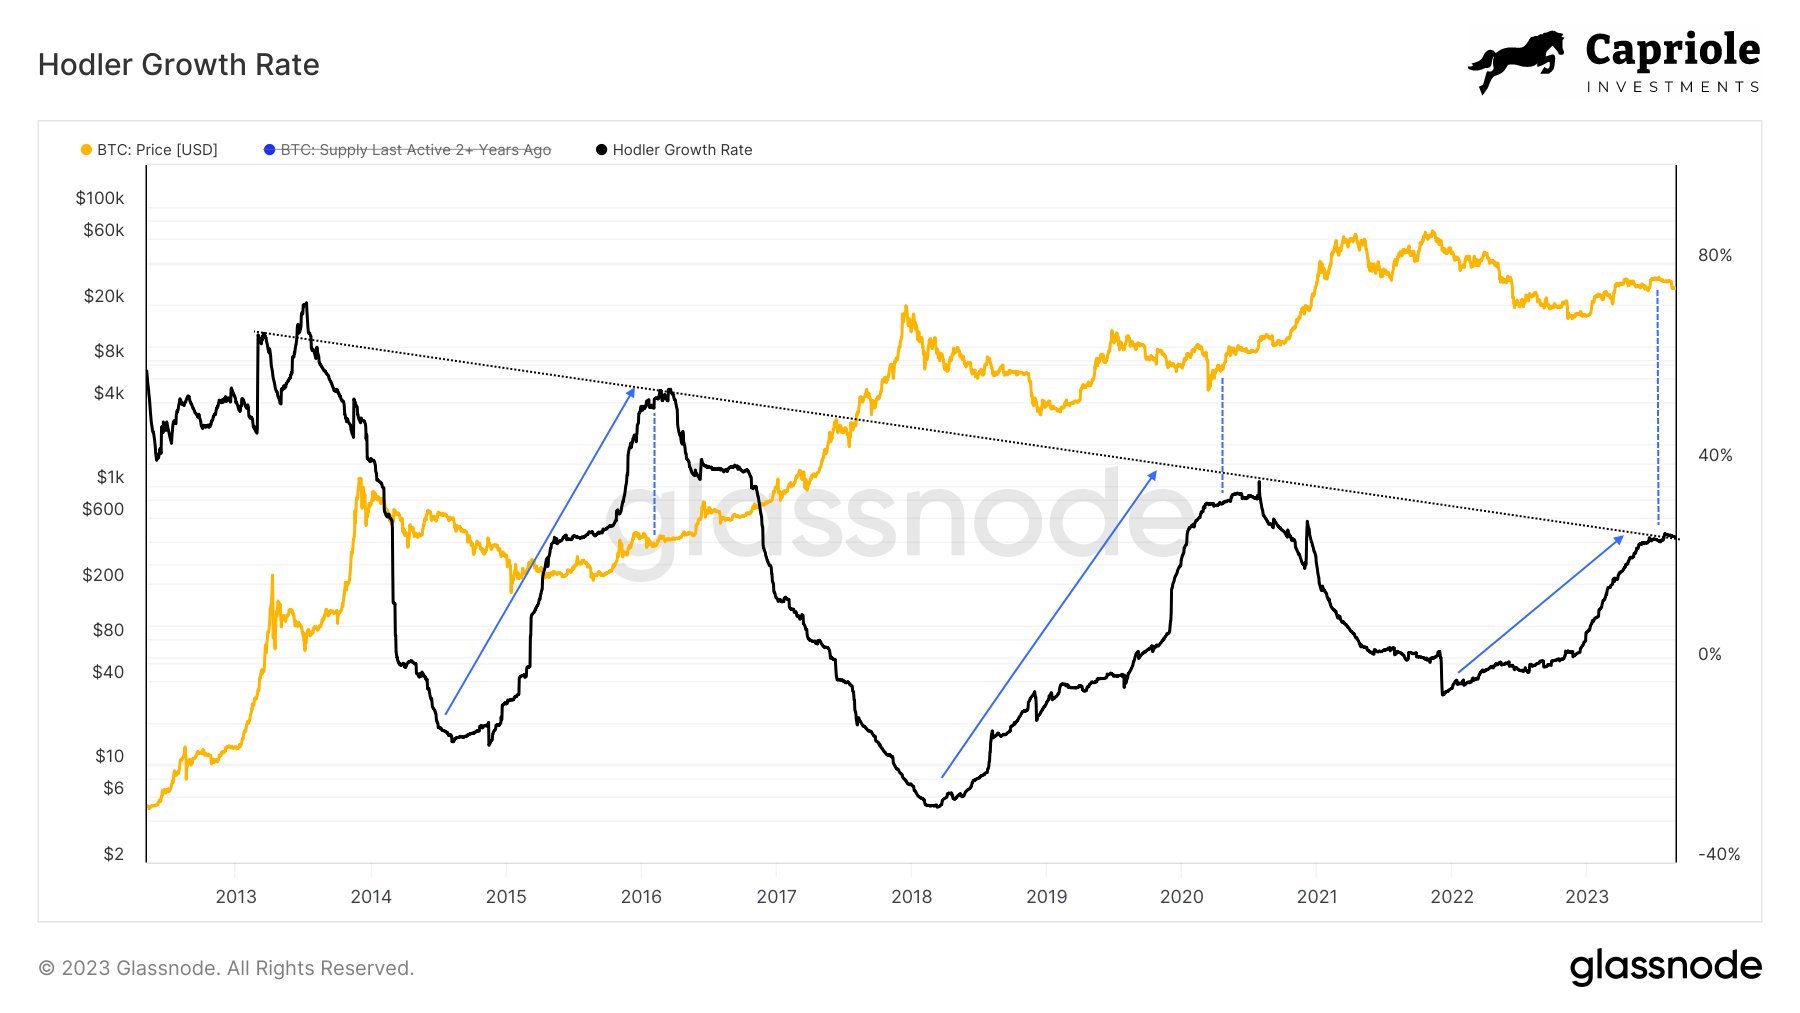
Bitcoin Bull Run Incoming? This Metric Could Suggest So
On-chain data shows a Bitcoin metric is forming a pattern that may hint that a bull run could be coming next for the asset. Bitcoin HODLer Growth Rate Has Seemingly Reached The “Plateau” Stage In a new post on X, the analyst Charles Edwards shared a chart highlighting a pattern that the BTC “HODLer Growth Rate” indicator may be forming. дальше »
2023-8-29 23:00 | |
|
|
BNB Chain leaves no stone unturned as it strives to improve network activity
BNB Chain’s daily active addresses and transactions have been declining for months. BNB’s weekly chart was flat, but its funding rate turned red. BNB Chain [BNB] continues to remain the The post BNB Chain leaves no stone unturned as it strives to improve network activity appeared first on AMBCrypto. дальше »
2023-8-28 12:30 | |
|
|
BONE Coin Surges 11% On Weekly Chart Amid Crypto Turbulence – What’s Next?
In the aftermath of the crypto market sell-off, BONE/USD currently trades at $1. 31 in the last 24 hours, with a trading volume of $8. 8 billion. This marks an over 11% price increase in the last seven days. дальше »
2023-8-28 01:00 | |
|
|