2021-8-12 18:40 |
Polygon (MATIC) has broken out from a descending resistance line and is attempting to clear the $1.42 horizontal resistance area.
While technical indicators are bullish, the token has to reclaim this level in order for the trend to be considered bullish.
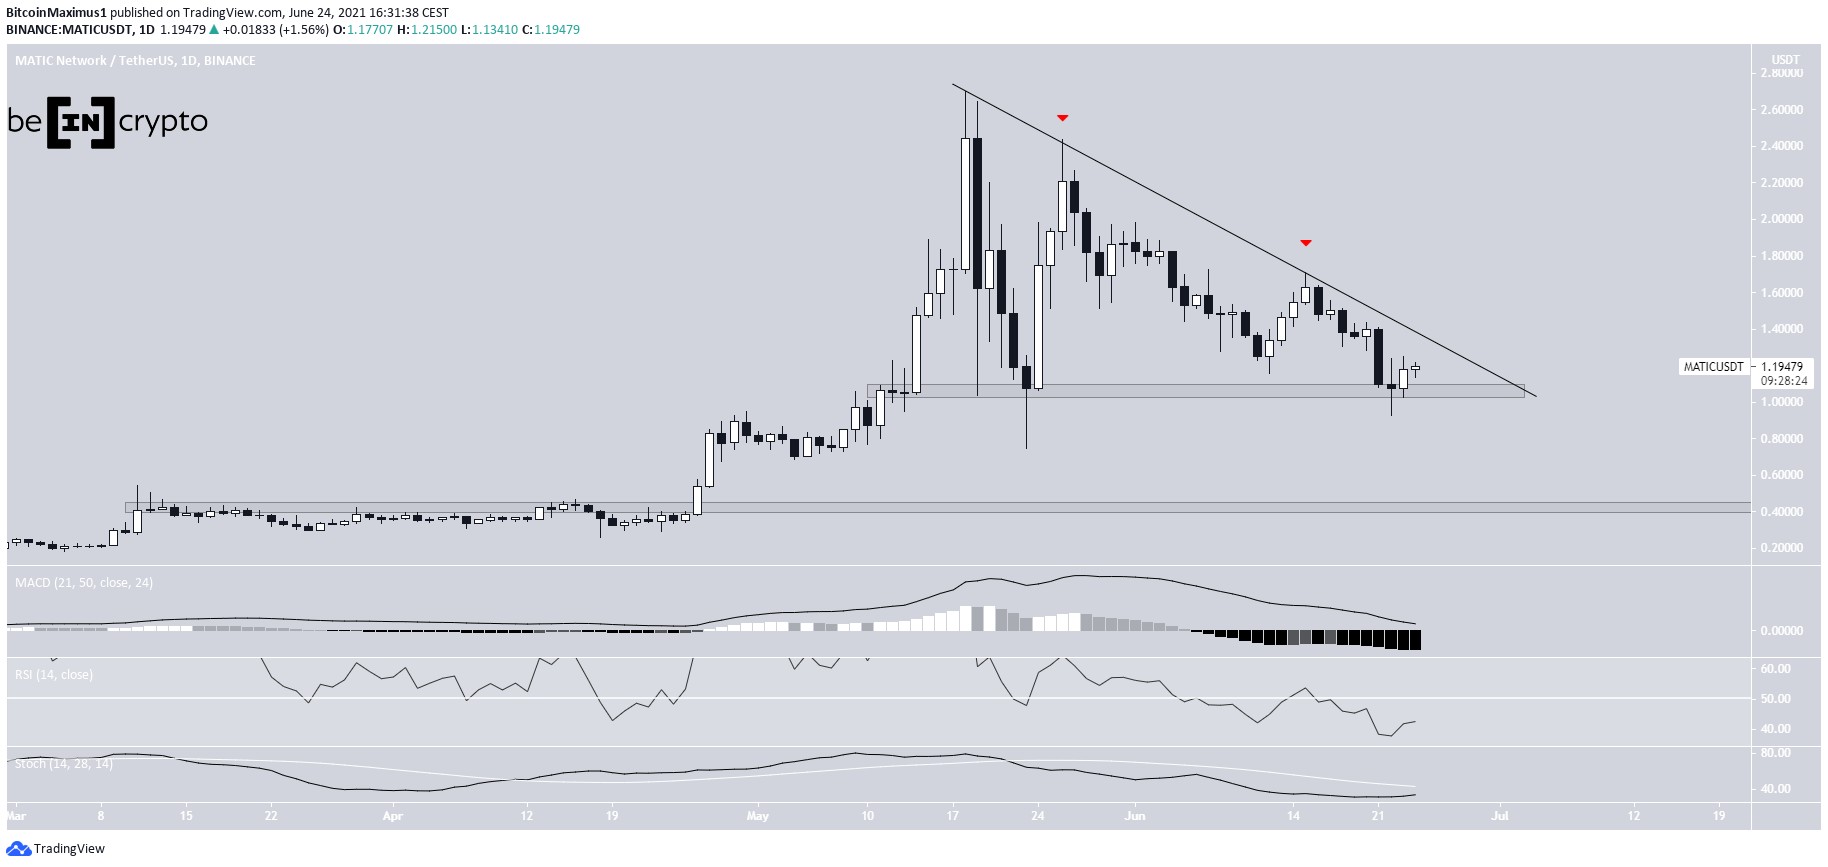
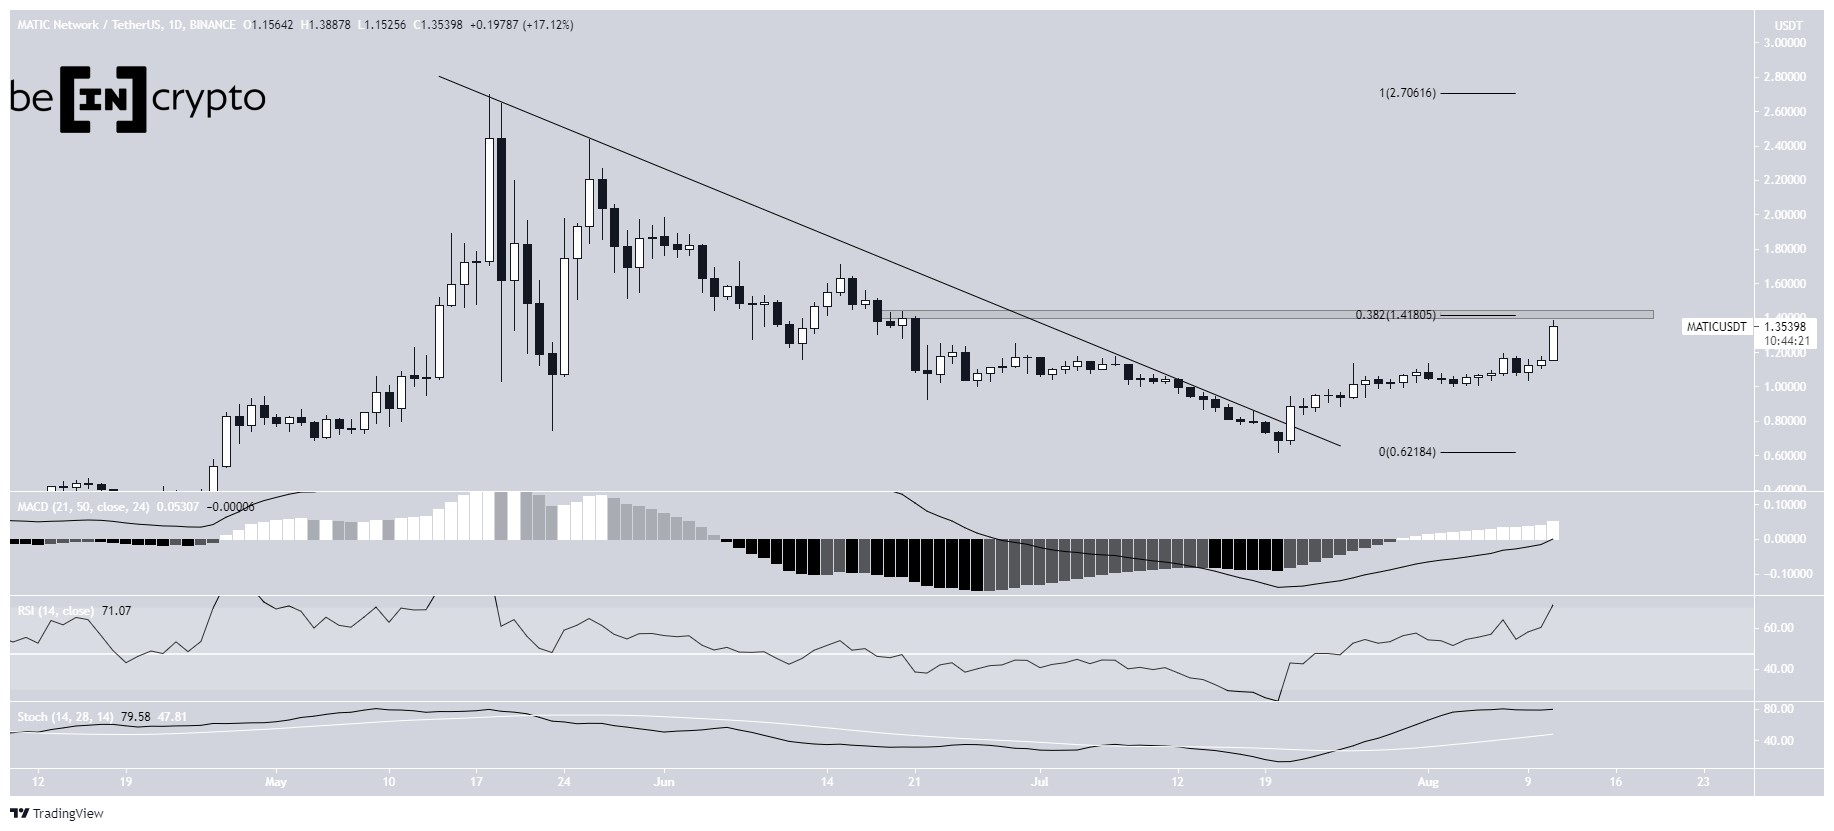
MATIC breaks outMATIC had been following a descending resistance line since May 18. However, it bounced on July 20 and managed to break out from the line the next day.
So far, it has reached a high of $1.388, doing so on Aug. 11. The high was made very close to the $1.42 horizontal resistance area, which is also the 0.382 Fib retracement resistance level. A breakout above this level could be the catalyst for a sharp increase towards $2 and higher.
Technical indicators in the daily time-frame do not yet show any signs of weakness. The MACD is positive, the RSI is above 70 and the Stochastic oscillator is increasing.
Chart By TradingView Short-term movementCryptocurrency trader @Thebull_crypto outlined a MATIC chart, stating that the ensuing breakout could take it towards $1.60.
Source: TwitterHowever, as outlined above, the main resistance area seems to be at $1.42. This is also visible when looking at lower time-frames, which shows a potential ascending parallel channel.
The resistance line of the channel is exactly at $1.42. Therefore, this is a strong resistance level which could cause a rejection. Until MATIC breaks out, the trend cannot be considered bullish.
Similarly to the daily time-frame, technical indicators are bullish, supporting the continuation of the upward movement at least until the resistance area is reached.
Chart By TradingView MATIC/BTCThe MATIC/BTC chart shows a similar breakout from a descending resistance line. In addition to this, the token has made one higher low, doing so on Aug. 9.
The main resistance area is at 3300 satoshis. Until MATIC manages to successfully move above this level, the trend cannot be considered bullish.
However, technical indicators in the daily time-frame support the possibility of a breakout. The RSI has moved above 50 and the MACD is nearly positive.
If a breakout transpires, the next closest resistance would be at 4700 satoshis.
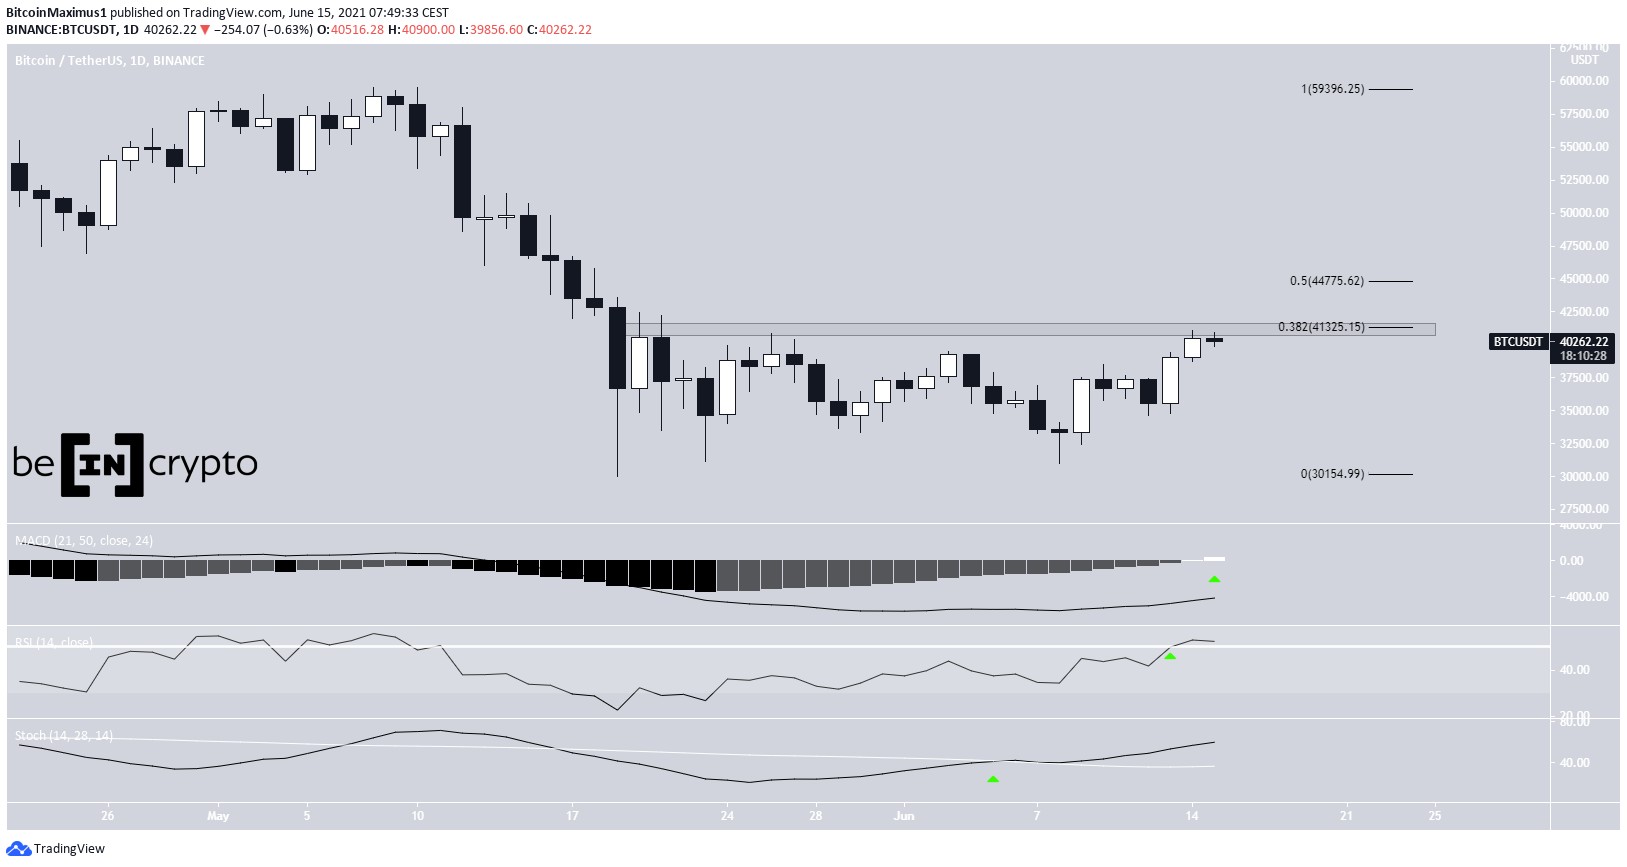
https://www.tradingview.com/symbols/MATICBTC/?exchange=BINANCEFor BeInCrypto’s latest bitcoin (BTC) analysis, click here.
The post MATIC Rallies Considerably and Breaks Out Above Resistance appeared first on BeInCrypto.
origin »Bitcoin price in Telegram @btc_price_every_hour
Resistance (RES) на Currencies.ru
|
|