2020-1-7 18:49 |
On January 6, digital currency markets saw decent gains as the entire crypto market capitalization surpassed the $200 billion mark at 3:50 p.m. EST. Since then most cryptocurrencies have tested heavy resistance and a slew of assets are being held back. Moreover, crypto trade volumes have increased significantly and there’s been roughly $83 billion in digital asset swaps in the last day.
Also Read: Meet the Multi-Cryptocurrency PoS Device Eletropay
Top Cryptocurrencies Gain 5-10%A number of digital assets on Monday saw considerable spikes in fiat value as BTC jumped from the $7,400 range to the $7,900 zone in a matter of no time. Today most cryptos have lost a small fraction of the value they gained the day before as only four out of the top 10 coins are seeing percentage gains on Tuesday morning. At press time the overall market valuation of all 4,000+ cryptocurrencies is around $209 billion. BTC is capturing 68% of the cryptoconomy with a $142 billion market cap. Currently, BTC is trading for $7,868 per coin and the crypto is up 4.1% today and 7.8% for the entire week. BTC neared the 100-day average resistance on Monday and touched a high of $7,999 on Bitstamp before being pushed back.
ETH markets are down 0.12% on Tuesday as each coin is swapping for $141. The cryptocurrency had a better week, however, as ETH gained 5.9% during the last seven days. XRP is still trailing behind ETH’s coattails as each XRP is trading for $0.20. That’s roughly a loss of 1.3% during Tuesday’s morning trading sessions but overall XRP jumped 8% this week. The stablecoin tether (USDT) holds the fourth largest market cap today which is around $4.63 billion at the time of publication.
Bitcoin Cash (BCH) Market ActionBitcoin cash (BCH) markets had a good week as the decentralized crypto jumped 11% during the last seven days. BCH is down a hair today at -0.04% and is trading for $236 per coin. The digital asset has an overall market valuation of around $4.3 billion on Tuesday and $2 billion worth of BCH trades were swapped in the last 24 hours. Fxstreet analyst Tanya Abrosimova explained on Monday that BCH was the fastest-growing coin as far as percentage gains are concerned. However, she noted that the “upside may be limited by a $240 handle” which turned out to be the case late Monday evening.
Just like BTC’s movements, only stronger, for the first time in months, BCH/USD prices tested the currency’s 100-day average resistance. “From the long-term point of view, a sustainable move above SMA100 (Simple Moving Average) daily at $229.00 has improved the outlook for BCH/USD and brought $240.00 back into focus,” Abrosimova wrote on January 6. “While this barrier remains unbroken, but as long as the price stays above $230-299 area, we have a chance for a retest of $240 and an extended recovery towards $280.30 (SMA200 daily),” the analyst added.
Bitcoin and IranOver the last few days, there have been some rumors that the escalated turmoil between the U.S. and Iran is benefiting BTC’s recent price spike. After Iranian leader Qassem Soleimani was killed in a drone attack, BTC’s fiat value jumped more than 8%. There’s a number of people who believe the theory and deVere Group’s founder Nigel Green says: “Bitcoin is living up to its reputation as ‘digital gold.’” “We’ve seen Bitcoin price surges before during times of heightened geopolitical tensions.”
Additionally, a few people had assumed that BTC was trading for $24,000 per BTC but Perennium.io founder Mehran Jalali explained this week that’s not the case. “The going market rate for the U.S. dollar to the Iranian rial is one dollar to 136,500 rials,” Jalali stated. “The current bitcoin to rial rate posted on Iranian crypto exchange websites is around one bitcoin to 984,000,000 rials, equal to $7,208 per bitcoin in Iran, which is very close to the going rate everywhere else,” he added.
Extremely Optimistic Price Predictions in 2020 ContinueDespite the fact that during the end of 2019, digital currency and BTC prices saw significant declines, no matter the trend, BTC price predictions continue. Last Friday, Antoni Trenchev, the cofounder of Nexo, told Bloomberg that BTC will touch $50K by the year’s end. Trenchev claims the BTC narrative has changed a great deal. “The narrative, that is much more persuasive is that bitcoin is the new gold, and we see confirmation with the turmoil that we have this morning. Bitcoin’s rally [is] on par with gold.”
Although BTC price predictions from industry influencers were the laughing matter of the Reddit forum r/buttcoin this week. The Reddit account u/Crypto_To_The_Core shared 26 ‘expert’ price predictions from 2019 that failed to materialize. For instance, Pantera Capital CEO Dan Morehead said BTC would hit $20K and analyst Ronnie Moas said the price would touch $28K by the year’s end.
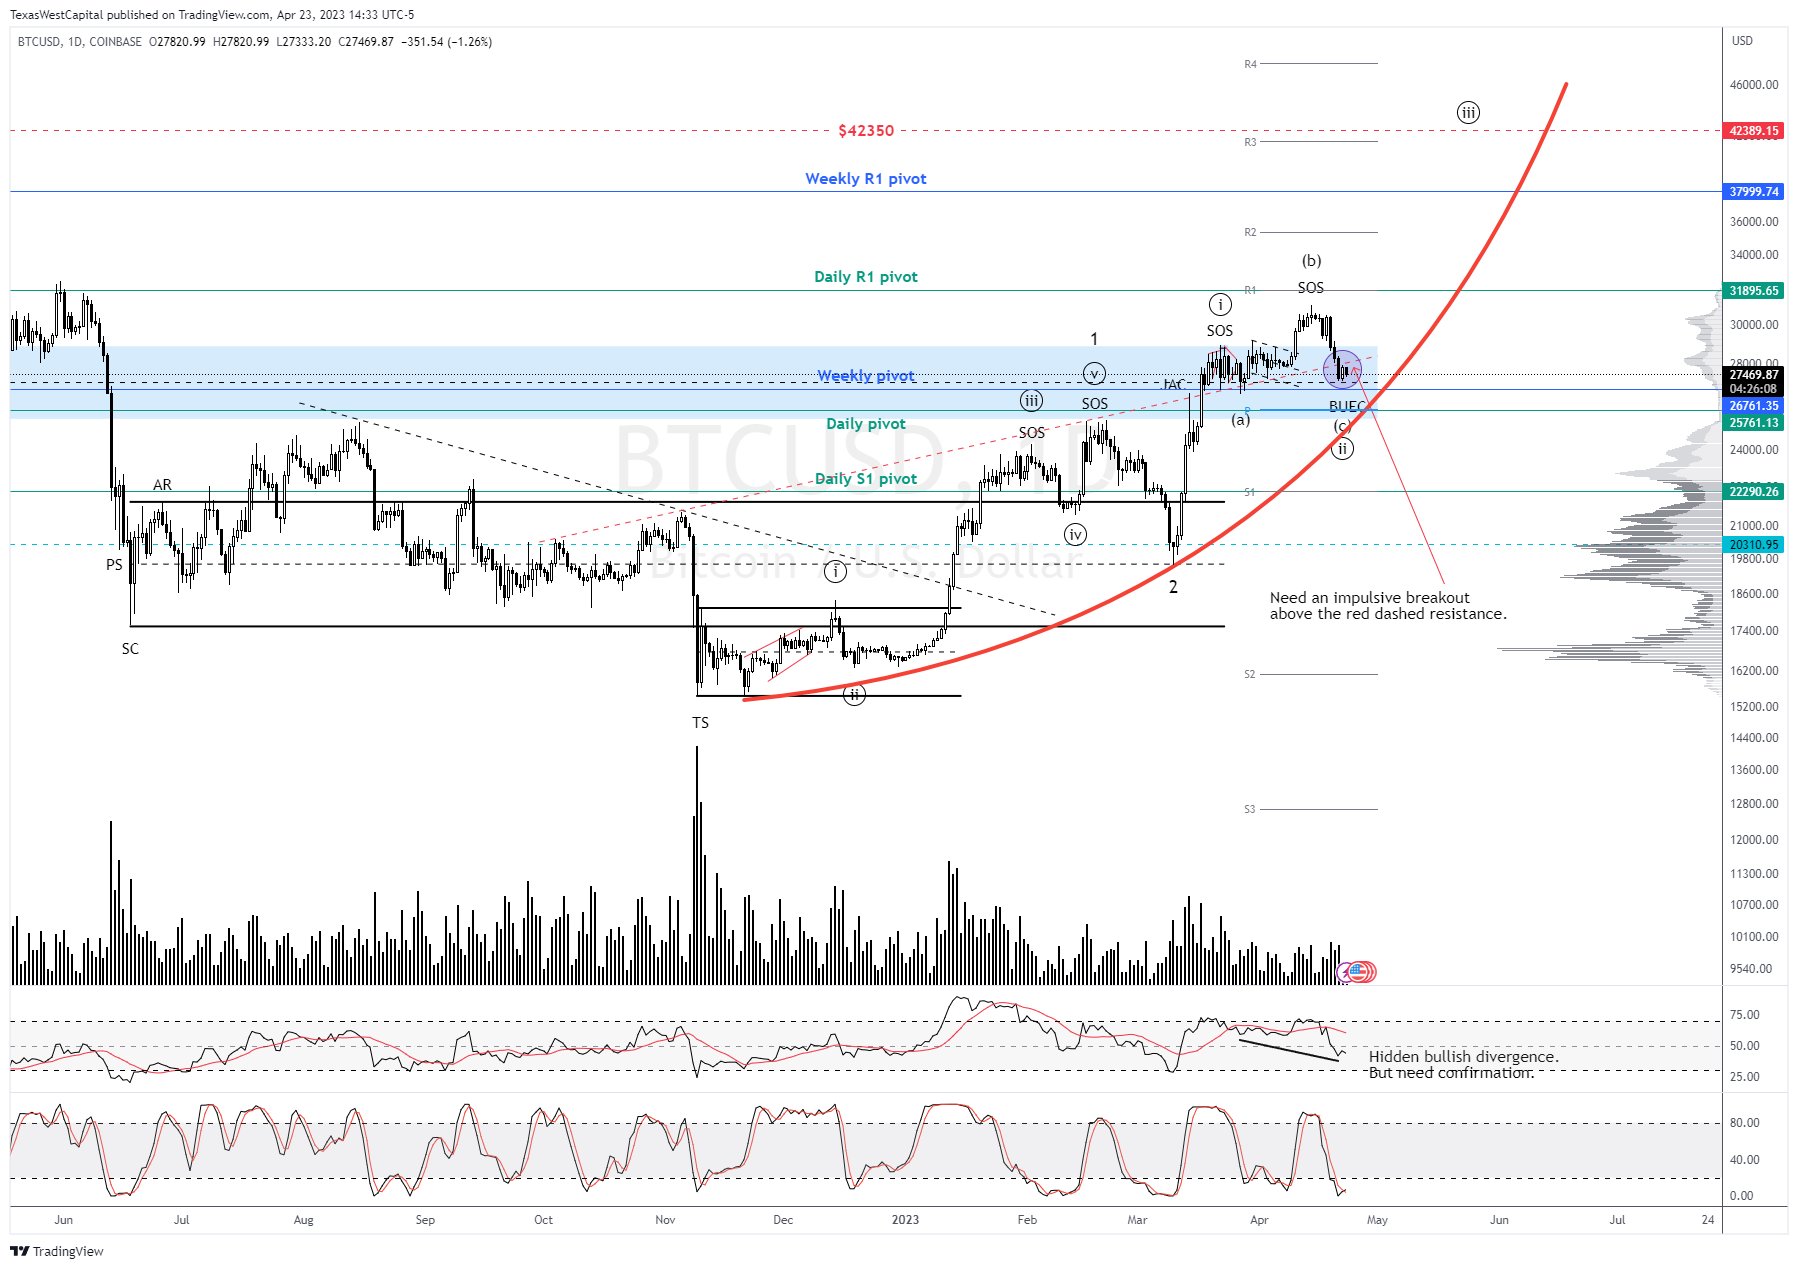
Wyckoff’s Sign of StrengthFormer Goldman Sachs analyst Murad Mahmudov shared a chart on Twitter on Tuesday that shows BTC may be following a Wyckoff pattern. Wyckoff events or phases were created by the well known stock trader Richard Wyckoff which show that potential moves (tops, bottoms) out of the usual pattern can denote traders’ price transitions.
Mahmudov’s chart shows that BTC is in an SOS (sign of strength) phase at the moment and the movement suggests a possible price rise. Mahmudov didn’t comment on where he thinks the price will go from here but the Wyckoff chart shared has traders wondering if BTC will follow the trend.
Overall digital currency prices are holding steady, well above the prices they were a few days ago. This is attributed to a decline in BTC/USD long positions which touched an all-time high on December 22. BTC/USD shorts are low and haven’t gathered much steam in the last two weeks. ETH/USD longs and shorts have been following a similar pattern as ETH long positions are rising exponentially and ETH shorts are not being played much at all. The recent digital currency price spike has traders curious as to which way the markets will go next.
Where do you see the cryptocurrency markets heading from here? Let us know what you think about this subject in the comments section below.
Disclaimer: Price articles and market updates are intended for informational purposes only and should not be considered as trading advice. Neither Bitcoin.com nor the author is responsible for any losses or gains, as the ultimate decision to conduct a trade is made by the reader. Always remember that only those in possession of the private keys are in control of the “money.” Cryptocurrency prices referenced in this article were recorded at 10:35 am EST on January 7, 2020.
Images via Shutterstock, r/buttcoin, Trading View, Bitcoin.com Markets, Twitter, Murad Mahmudov, Coinlib.io, Wiki Commons, and Pixabay.
Want to create your own secure cold storage paper wallet? Check our tools section. You can also enjoy the easiest way to buy Bitcoin online with us. Download your free Bitcoin wallet and head to our Purchase Bitcoin page where you can buy BCH and BTC securely.
The post Market Update: Top Cryptos Face Strong Resistance Ahead appeared first on Bitcoin News.
origin »Bitcoin price in Telegram @btc_price_every_hour
Market.space (MASP) на Currencies.ru
|
|