2021-6-14 16:32 |
“BTC needs another major catalyst to regain momentum and combat some of the uglier charts in the near term,” said Kevin Kelly, co-founder and head of global macro at Delphi Digital, in his latest report.
In April, Bitcoin hit its all-time high at nearly $65,000, and last month, it had a drawdown of 54% to 57% as the price fell to $30,000 on Coinbase and $28,000 on some exchanges. Today, that price finally crossed the $40k mark on the news that legendary investor, Paul Tudor Jones, has upped his allocation of bitcoin to 5% of his portfolio. He originally said 2% back in May of 2020.
Slashing of Bitcoins’ value by half was driven by the major unwind in leveraged positions, profit-taking following one of BTC’s best runs, and of course, the narrative of crypto-mining not being good for the environment.
“When everyone is leveraged long, it’s not a matter of if but when a major correction will take place.”
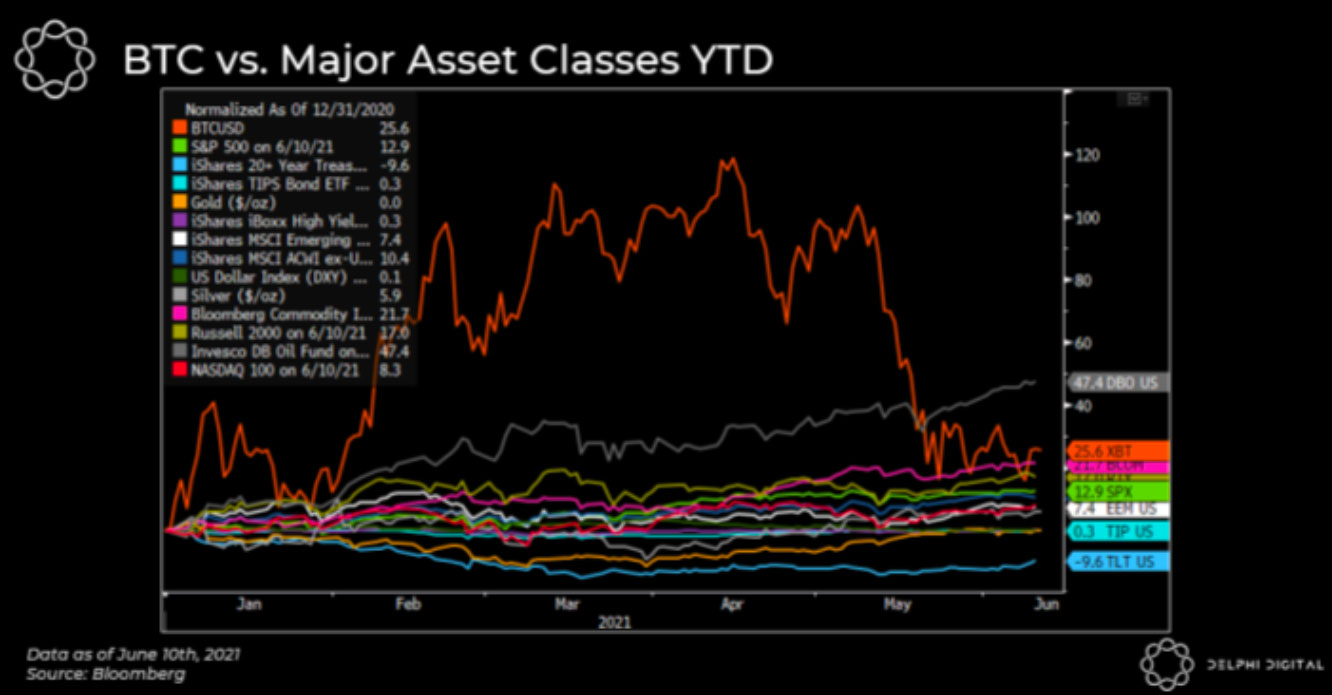
Wiping out all the gains of 2021 has the cryptocurrency’s year-to-date gains now at just over 35%. In comparison, ETH is up 236%, WTI 45.71%, and S&P 500 13.08%. Both gold and dollar’s YTD gains are negative by 1.20% and 0.57%, respectively.
Still, more than 85% of Bitcoin UTXOs are in profit — “price bottoms following historical drawdowns of similar magnitude tended to coincide with a drop in the % of profitable UTXOs to at least ~55%.”
The total supply of Bitcoin by long-term holders on a percentage basis which recently bottomed at 58.5%, is also now back above 61%, a good sign for the longer term.
For now, BTC has strong support at around $30k, but if it breaks down, the prices can very well dive below $20k.
Not to mention, the death cross is coming — BTC’s 50-day MA is on the verge of crossing below its 200-day equivalent for the first time since March 2020. As we reported, this leads to a bullish golden cross like many times in history, but this could also turn out like 2017 when it solidified the bear market, which would mean the bottom may not be in quite yet.
However, there’s more to Bitcoin price than just technical analysis.
As we saw recently, the sentiments towards cryptocurrency have turned sour, with the Crypto Fear & Greed Index falling to its lowest level since the March 2020 sell-off. On May 30, the reading was 10, which has now gone up to 28.
One of the biggest macro headwinds to BTC, according to Kelly, is the deceleration in the growth of central bank asset purchases.
Historically, the price tends to peak at roughly the same time as y/y growth in major central bank balance sheets, which hit $8 trillion for the first time last week.
With the trend of large-scale debt monetization and asset purchases likely to continue, it spells bullish for Bitcoin, but the talks of tighter monetary policy in the face of rising inflation could serve as a headwind for BTC in the near term.
Bitcoin and crypto actually rated to sell-off around the time inflation expectations actually peaked in mid-May. “It’s an important distinction because markets trade on changes in expectations, not backward-looking data prints,” said Kelly.
However, not only “the long-term chart clearly shows BTC still in an uptrend” despite the recent drawdown and compared to previous cycles, the price trajectory still looks to be right on track, so unless $20k is retested, Bitcoin can continue higher.
Bitcoin/USD BTCUSD 40,077.5170 $2,693.21 6.72% Volume 51.5 b Change $2,693.21 Open$40,077.5170 Circulating 18.73 m Market Cap 750.85 b baseUrl = "https://widgets.cryptocompare.com/"; var scripts = document.getElementsByTagName("script"); var embedder = scripts[scripts.length - 1]; var cccTheme = {"Chart": {"fillColor": "rgba(248,155,35,0.2)", "borderColor": "#F89B23"}}; (function () { var appName = encodeURIComponent(window.location.hostname); if (appName == "") { appName = "local"; } var s = document.createElement("script"); s.type = "text/javascript"; s.async = true; var theUrl = baseUrl + 'serve/v1/coin/chart?fsym=BTC&tsym=USD'; s.src = theUrl + (theUrl.indexOf("?") >= 0 ? "&" : "?") + "app=" + appName; embedder.parentNode.appendChild(s); })(); var single_widget_subscription = single_widget_subscription || []; single_widget_subscription.push("5~CCCAGG~BTC~USD"); The post Long-Term Chart Clearly Shows Bitcoin Still in an ‘Uptrend’ But Biggest Macro Headwinds Looms Over Price first appeared on BitcoinExchangeGuide. origin »Bitcoin price in Telegram @btc_price_every_hour
Macro (MACRO) на Currencies.ru
|
|


