2021-1-28 12:46 |
The TD Sequential indicator has flashed a buy signal on the 2-hour and 4-hour charts to suggest a potential rebound above $140
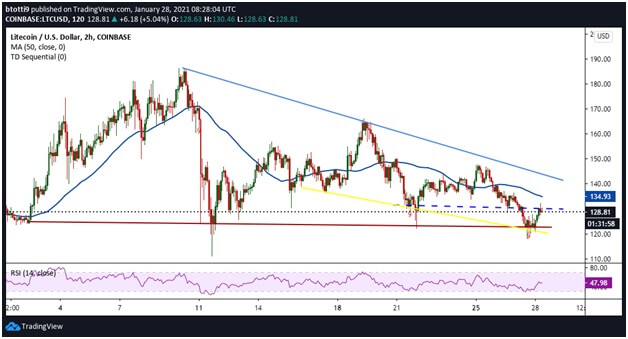
Litecoin (LTC) is trading near $128 against the US Dollar after bouncing off the horizontal support of a descending triangle pattern at $121. LTC/USD has therefore managed to hold above crucial support around $127, igniting optimism among bulls.
As shown below, the upside in Litecoin’s price follows the appearance of a buy signal suggested by the TD Sequential indicator on the 2-hour chart.
LTC/USD 2-hour chart. Source: TradingView
The indicator has presented a red nine candlestick, which indicates the potential for an influx of buying pressure as sellers seem to retreat. The buy signal has been pretty accurate for LTC, with its last appearance seeing bulls push LTC/USD from lows of $130 to highs of $147.
The uptrend reversed when Bitcoin’s slump towards $29k dampened crypto sentiment, resulting in a broader sell-off across major altcoins. LTC price declined to $121 before the latest recovery efforts.
Buyers face an uphill task reclaiming control above $140, but the short term outlook suggests breaking above $130 will open up a path for bulls to easily test the 50-day simple moving average ($134).
From here, LTC bulls are likely to quickly rally towards $140 or see a few days of sideways trading as momentum builds for a breakout above the triangle pattern.
If we look at the RSI, it is trending below the 50 level suggesting bears are not going to relent that easily. However, the indicator is presenting with a hidden bullish divergence to indicate the potential for the outlook to flip positive on increased upside volume.
LTC/USD 4-hour chart. Source: TradingView
The 4-hour chart also has the TD Sequential indicator flashing a buy signal, with bulls looking to ride the upside towards the 50-SMA ($137).
The 4-hour RSI also presents with a similar outlook to that of the 2-hour chart. Bulls are therefore likely to struggle to break the resistance wall around $135—$140. If they manage on increased upside momentum, retesting recent highs of $185 would be possible short term.
If bulls fail to sustain the upward move, downward pressure could push prices below the horizontal support of the descending triangle pattern. This scenario could see LTC/USD plummet past $120 towards the psychological $100 level.
The post Litecoin price: buy signal suggests possible rebound to $140 appeared first on Coin Journal.
origin »Bitcoin price in Telegram @btc_price_every_hour
Burency (BUY) на Currencies.ru
|
|