2023-7-6 18:00 |
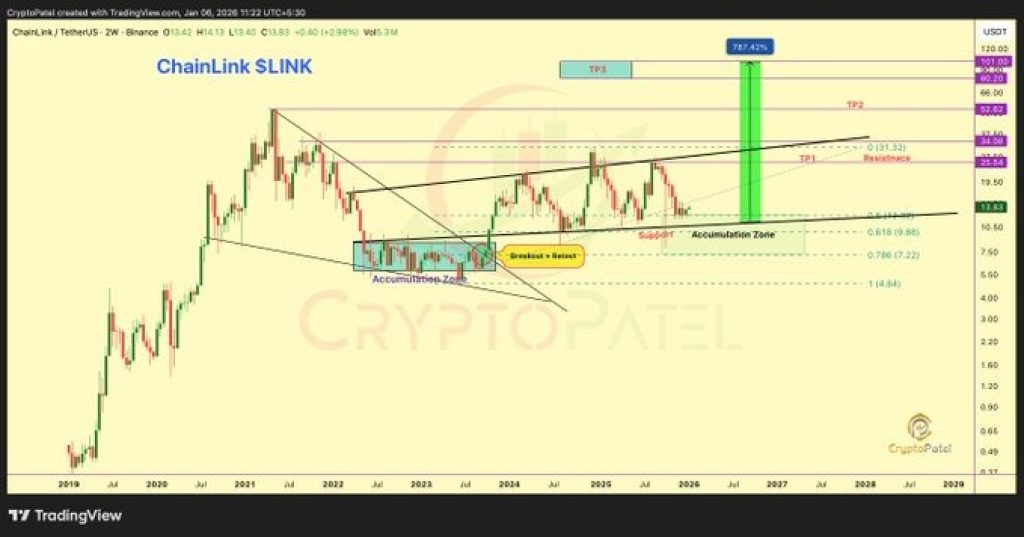
The Chainlink (LINK) price shows bullish long-term signs since it saved a breakdown from a long-term horizontal support area. Now, it is attempting to validate that same area as support.
While the long-term readings are decisively bullish, short-term ones indicate that the price has begun a retracement. After creating a higher low, the LINK price can resume its increase to new highs.
Chainlink Price Falls After RejectionThe weekly time frame outlook shows that the LINK price has traded slightly above the $5.80 horizontal support area since April 2022. During this time, it faced resistance at $8.90.
However, at the beginning of June 2023, the price fell below the $5.80 horizontal area. This seemingly caused a breakdown from a yearlong horizontal support area. But, the LINK price bounced afterward and has increased since.
The increase renders the previous breakout as only a deviation (green circle). Significant upward movements usually follow such deviations, as was the case in the price of LINK.
LINK/USDT Weekly Chart. Source: TradingViewDespite the reclaim, the weekly RSI provides a neutral reading. The RSI is a momentum indicator used by traders to evaluate whether a market is overbought or oversold and to determine whether to accumulate or sell an asset.
Readings above 50 and an upward trend suggest that bulls still have an advantage, while readings below 50 indicate the opposite. The RSI is increasing but is above 50. These mixed signs suggest that the direction of the trend is undetermined.
Read More: 6 Best Copy Trading Platforms in 2023
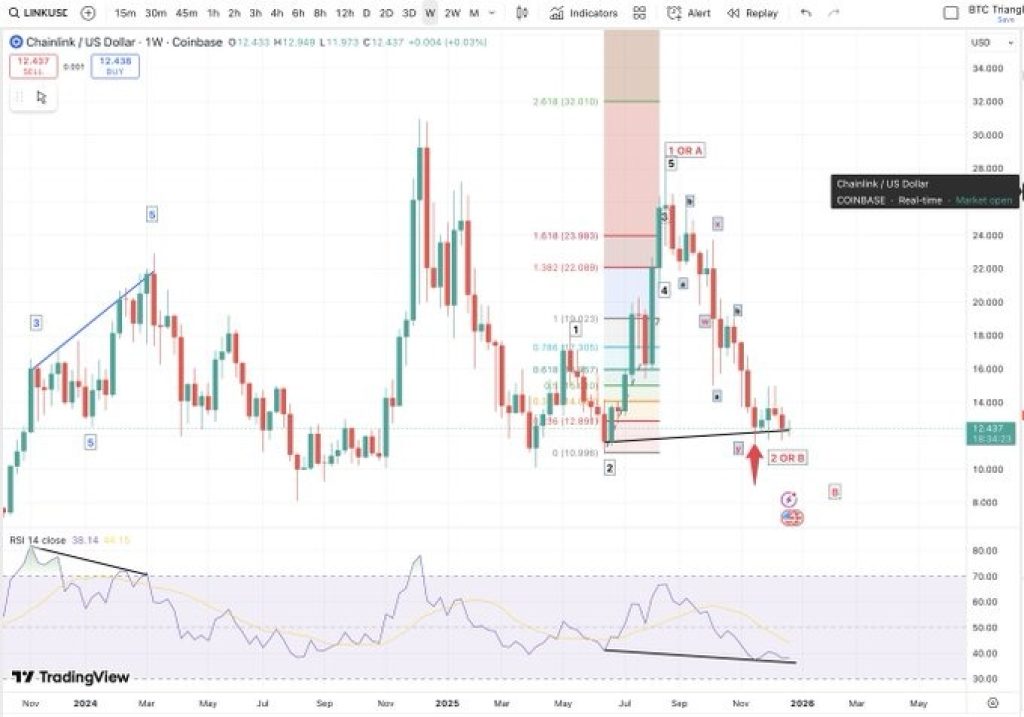
LINK Price Prediction: Wave Counts Supports Increase to Double DigitsWhile the weekly chart is still undetermined, the technical analysis from the daily time frame provides a decisively bullish outlook. The main reason for this is the wave count, but the RSI also supports the ongoing increase.
The LINK price has completed a five-wave increase (black) since the June 10 bottom. This aligns with the possibility that the LINK price has begun a bullish trend reversal. However, the price is now correcting inside an A-B-C corrective structure.
The most likely level for the correction to end will be at the 0.5 Fib retracement support level at $5.73.
Elliott Wave theory involves the analysis of recurring long-term price patterns and investor psychology to determine the direction of a trend.
The most likely wave count suggests that the current increase is only the first wave of a large five-wave upward movement (white). If so, the price will eventually break out above the $9 resistance area and move into double digits.
Moreover, the daily RSI is increasing and is above 50, both signs of a bullish trend.
LINK/USDT Daily Chart. Source: TradingViewHowever, despite this bullish LINK price prediction, falling below the June 10 low of $4.69 will mean that the trend is still bearish. In that case, a decrease to $4 will be the most likely outcome.
Read More: Crypto Signals: What Are They and How to Use Them
For BeInCrypto’s latest crypto market analysis, click here.
The post Is Chainlink (LINK) Price Reversing for a Move Above $10 appeared first on BeInCrypto.
origin »Bitcoin price in Telegram @btc_price_every_hour
ChainLink (LINK) на Currencies.ru
|
|