2021-7-30 11:16 |
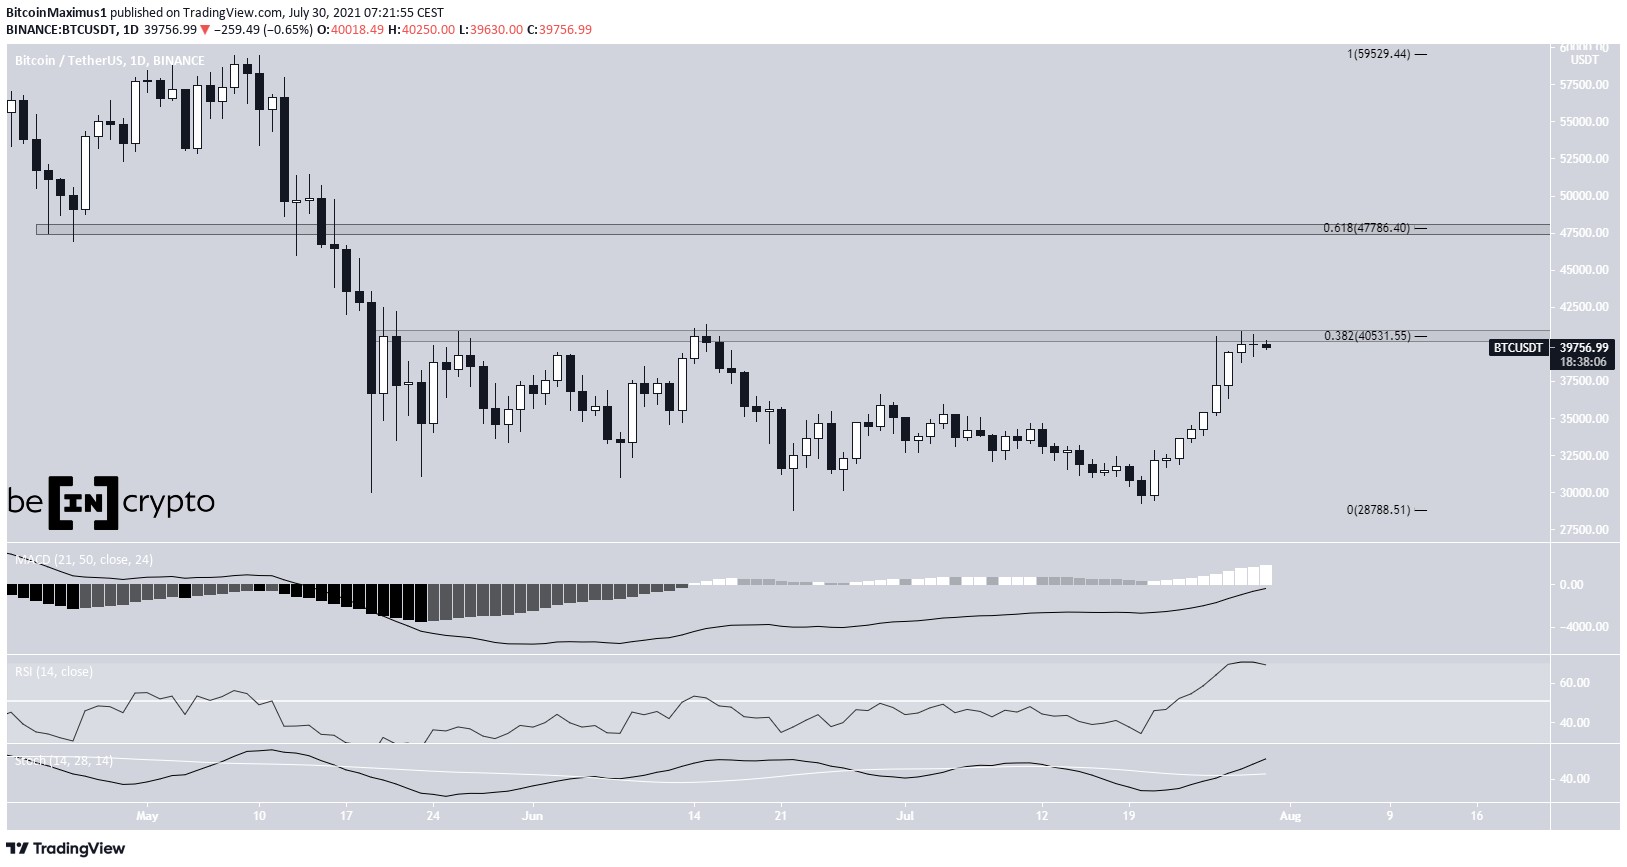
Bitcoin (BTC) made another attempt at breaking out above the $40,500 resistance area yesterday. However, this push was unsuccessful.
BTC is still consolidating below this area, potentially gearing up for another breakout attempt.
BTC fails to break outBTC has been moving upwards since July 20. After creating eight successive bullish candlesticks, it finally created a doji candlestick with a slightly bearish close on July 29.
This was the third failed breakout attempt above the $40,500 horizontal resistance area, which is also the 0.382 Fib retracement resistance level.
Despite the rejection, technical indicators in the daily time frame are still bullish. The Stochastic oscillator made a bullish cross, the RSI moved above 70, and the MACD is nearly positive.
The next resistance area is found at $47,800. This is the 0.618 Fib retracement resistance level.
BTC Chart By TradingView Future movementThe two-hour chart provides mixed readings. Initially, both the MACD and RSI generated bearish divergences. This was followed by a small drop in the price of BTC.
There is also an ascending support line that’s been in place since the July 20 lows, which is still intact. As long BTC is trading above the line, the trend can be considered bullish.
If a breakdown were to occur, the closest support level would be found at $33,600. THis target is the 0.618 Fib retracement support level.
BTC Chart By TradingView Wave countThe wave count still suggests that BTC is in wave C of an A-B-C corrective structure. The most likely target for the top of the move is $42,181. This would giving waves A:C a 1:1.61 ratio.
The sub-wave count is shown in red, suggesting that the price is currently in sub-wave four.
BTC Chart By TradingViewA closer look shows that BTC is potentially trading inside a symmetrical triangle as part of wave four.
Using a Fib projection (red) and the length of sub-wave one (black), we get a slightly higher target between $42,900 and $43,800.
BTC Chart By TradingViewFor BeInCrypto’s previous bitcoin (BTC) analysis, click here.
The post Is Bitcoin (BTC) Able to Break Out Above $40,500? appeared first on BeInCrypto.
origin »Bitcoin price in Telegram @btc_price_every_hour
Bitcoin (BTC) на Currencies.ru
|
|