Новости о Pattern Could [ Фото новости ] [ Свежие новости ] | |

This Technical Pattern Indicates Bitcoin Could Soon Surge Past $11K
Bitcoin price revered losses and climbed to a new 2020 high at $10,406 against the US Dollar. BTC is now eyeing another bullish wave above $10,500 in the near term. Bitcoin is gaining bullish momentum above the $10,000 and $10,200 resistance levels against the US Dollar. дальше »
2020-2-12 08:18 | |
|
|
Litecoin Forming a Multi-Year Top Pattern May Cause an Epic Plunge
Litecoin, the silver counterpart to Bitcoin as digital gold, is often a leading indicator across the crypto market. If one particular Litecoin chart is accurate, it could be signaling an epic plunge in altcoins against Bitcoin in the coming months. дальше »
2020-2-6 20:03 | |
|
|
Analyst: this pattern shows Bitcoin could be bound for a massive July breakout
The past couple of days have been rocky for Bitcoin (BTC), with the benchmark cryptocurrency facing some notable downwards pressure in the time following its recent rejection at $9,600. It is important to note that the rejection at this level – although bearish over the short-term – may actually throw Bitcoin into a highly bullish […] The post Analyst: this pattern shows Bitcoin could be bound for a massive July breakout appeared first on CryptoSlate. дальше »
2020-2-5 06:00 | |
|
|
Bitcoin Could Fall Hard, This Textbook Indicator Shows
Bitcoin’s dreamy price rally in 2020 could hit a dead end in the coming sessions, according to a bullish reversal indicator. The benchmark cryptocurrency is forming a Rising Wedge pattern as confirmed by its price consolidating between upward sloping resistance and support. дальше »
2020-2-4 18:00 | |
|
|
Bitcoin Defies Gravity: Failed Head And Shoulders Could Trigger Massive Rally
Bitcoin price jumped above the $9,550 resistance to invalidate a key head and shoulders pattern against the US Dollar. It seems like BTC is primed for a massive rally above $10,000. Bitcoin bears failed to push the price below the main $9,150 support against the US Dollar. дальше »
2020-2-3 08:48 | |
|
|
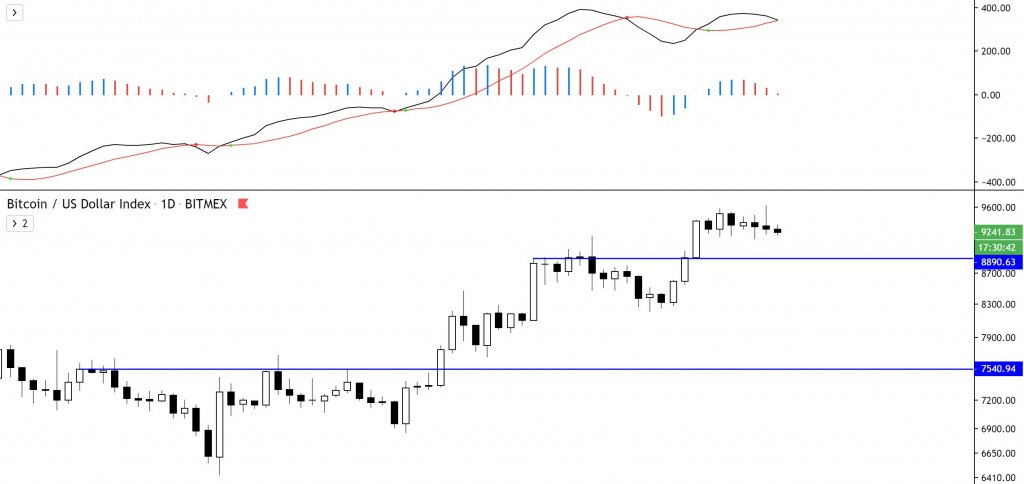
Bitcoin Bulls Alert: This Head & Shoulders Pattern Could Trigger Violent Drop
Bitcoin traded to a new 2020 high at $9,575 and recently corrected lower against the US Dollar. It seems like a head and shoulder pattern is forming, which could drag BTC towards $8,800. After a steady rise, bitcoin price struggled to gain momentum above $9,500 against the US Dollar. дальше »
2020-2-2 08:28 | |
|
|
XRP to witness 5% to 6% decline followed by sideways in the next 24 hours
At press time, XRP was stuck in a consolidation pattern. Breaching this could give XRP the break it has been looking for. The price of XRP is currently at $0.24 with a market cap of $10.5 billion and The post XRP to witness 5% to 6% decline followed by sideways in the next 24 hours appeared first on AMBCrypto. дальше »
2020-2-2 22:00 | |
|
|
Bulls Take Control of Litecoin Price Action
Litecoin hit an important milestone in its trend that could catalyze a new rally. However, contrary to the milestone, a technical pattern is signaling exhaustion. Demand for LTC is on the Rise In the last 24 hours, Litecoin experienced a bullish impulse that saw its price surge by 18%. дальше »
2020-1-31 03:49 | |
|
|

This Ontology Fractal Predicts a Massive Upward Move
The Ontology price is making an attempt at breaking out above a descending resistance line. Due to a bullish pattern and a similar previous fractal, it looks like it could be successful and move towards the next resistance area this time around. дальше »
2020-1-30 16:10 | |
|
|
How Bitcoin Could Hit $28,000 in The Next Six Months
Bitcoin has held on to gains again as longer term technical signals start switching to green. An approaching golden cross could yield bigger gains if last year’s pattern repeats. Bitcoin Holding Gains The move above $9,000 this week is holding strong as bitcoin begins to consolidate here. дальше »
2020-1-30 09:00 | |
|
|

XLM Could Soon Head for Range Highs
The XLM price has been decreasing since January 20. We believe this correction might have ended at the 650 satoshi support area and are expecting a breakout from the current pattern. XLM Highlights The price is trading inside a short-term descending wedge. дальше »
2020-1-30 04:29 | |
|
|
Ready For Liftoff: Two-Year Downtrend Breakout Could Lead to $14 XRP
XRP, the cryptocurrency commonly called Ripple, is in the midst of breaking out from downtrend resistance that has kept the crypto asset at low prices for over two full years of bear market. A breakout from what appears to be a bull flag or pennant pattern could shock the crypto market with rapid, explosive gains,... The post appeared first on NewsBTC. дальше »
2020-1-30 22:00 | |
|
|
Could Bitcoin halving follow the same pattern as Litecoin?
The upcoming Bitcoin halving set to happen sometime in May 2020, has been anticipated by many in the crypto community. Contributors and researchers have jumped into the discussion and made their commeThe post Could Bitcoin halving follow the same pattern as Litecoin? appeared first on AMBCrypto. дальше »
2020-1-27 13:30 | |
|
|
$20,000: This Pattern Suggests Bitcoin Could Rally 135% in Coming Months
Bitcoin has been stuck within a consolidation phase for the past several days, which was first seen when the crypto was ranging around $8,600. This was followed by a range expansion when BTC dipped to lows of $8,200 overnight before bouncing back to the mid-$8,000 region earlier today. дальше »
2020-1-25 04:00 | |
|
|
ICON (ICX) Successfully Breaks out Above 150-Day Resistance Line
On January 20, the ICON (ICX) price broke out above a descending wedge that had been developing since September 2019. This could be the beginning of a long-term upward movement. ICON Price Highlights The ICON price broke out from a long-term bullish reversal pattern. дальше »
2020-1-24 17:43 | |
|
|

IOTA Breaks out Above Long-Term Resistance Line
On January 14, the IOTA price broke out above a descending resistance line in place for 82 days. Since then, it has increased by nearly 30 percent. The movement could have been the first step in the creation of a long-term reversal pattern, which would be confirmed by a breakout over 2500 satoshis. дальше »
2020-1-21 05:00 | |
|
|

EOS Reversal Pattern Could Take It to 5000 Satoshis
On January 14, the EOS price broke out above a significant resistance area. The price has been decreasing since and has validated the previous resistance area as support. In the short-term, the price has created a bullish reversal pattern that coincides with the aforementioned support area. дальше »
2020-1-21 01:25 | |
|
|

ATOM Reversal Pattern Could Take it to 64,000 Satoshis
The Cosmos (ATOM) price has created a reversal pattern at the support area of 49,000 satoshis. From this level, the price is expected to continue moving upwards. Besides the reversal pattern (double bottom), the upward movement is supported by the ascending support line, which has been measuring ATOM’s rate of increase since October. дальше »
2020-1-17 10:20 | |
|
|

Enjin Coin (ENJ) Could Breakout Above 1,200 Satoshis in February
If the Enjin Coin (ENJ) price follows a similar pattern that it had laid out in 2018, it could break out above the current trading range between February and May. At the time of writing, the price was re-testing the 800 satoshi area, likely validating it as support. дальше »
2020-1-16 16:10 | |
|
|
Bitcoin Forming Double Top And It’s Vulnerable Below $8,500
Bitcoin struggled to break the $8,900 resistance on two occasions against the US Dollar. BTC price is showing a few bearish signs and it seems like it could decline towards $8,300 or $8,200. Bitcoin price is likely forming a double top pattern near the $8,900 resistance against the US Dollar. дальше »
2020-1-16 08:28 | |
|
|

Ravencoin’s Support Area Could Be the Catalyst for Another Upward Move
On January 14, the Ravencoin (RVN) price reached the 280 satoshi support area — a movement that historically has preceded significant upward movements. In anticipation of this possible increase, the RVN price has created a descending wedge — which is considered a bullish reversal pattern. дальше »
2020-1-16 06:25 | |
|
|
Ethereum Technical Analysis Sees ETH Track BTC Higher
Ethereum has a bullish short-term trading bias and a bearish medium-term outlook The four-hour time frame shows that a bullish inverted head and shoulders pattern has formed The daily time frame shows that a breakout above the $140 level could be very bullish for ETH/USD Ethereum is moving higher on Monday, as the second-largest cryptocurrency […] The post Ethereum Technical Analysis Sees ETH Track BTC Higher appeared first on Crypto Briefing. дальше »
2020-1-6 20:46 | |
|
|

XRP’s Previous Pattern Indicates Beginning of Bullish Market Cycle
The XRP price is approaching a yearlong descending resistance line. A breakout above it could trigger a rapid price increase, similar to October 2018 and November 2019. 2019 was not kind to XRP since the price decreased by 75%. дальше »
2020-1-5 05:34 | |
|
|
Bitcoin Analysis for 2020-01-03 [Premium Analysis]
Bitcoin Price Highlights The Bitcoin price broke down from a head and shoulders(H&S) pattern. The breakdown could not be sustained. The price created a bullish morning star pattern. The price has possibly created a longer-term inverse H&S pattern. дальше »
2020-1-4 17:04 | |
|
|

Will ICON (ICX) Break out From Its Long-Term Downward Trend? [Premium Analysis]
The ICON (ICX) price is nearing the end of its bullish pattern that has been in place since June 2019. A breakout could take it to a high of $0. 31. The closest resistance area is found at $0. 18. дальше »
2020-1-3 17:25 | |
|
|
Ripple (XRP) Bulls Aim Larger Breakout Above $0.20
Ripple price is consolidating above the $0. 1850 and $0. 1880 support levels against the US dollar. XRP could start a larger rally if it clears the main $0. 2000 resistance area. There is a major breakout pattern forming with resistance near $0. дальше »
2020-1-2 07:28 | |
|
|

Cardano May Revisit Its Range Lows, Says Analyst [Premium Analysis]
The ADA price has decreased by 75% since the beginning of April. It has created an ascending triangle, out of which we believe it will break out. However, due to the gradual slope of the pattern, this breakout could take months to materialize. дальше »
2019-12-28 11:34 | |
|
|
Bitcoin Analysis for 2019-12-27 [Premium Analysis]
The Bitcoin price broke out from a descending channel and reached a high of $7250 before decreasing. It has created a head and shoulders pattern, a breakdown from which could take it to $6400. Bitcoin Price Highlights The Bitcoin price broke out from a descending channel. дальше »
2019-12-27 14:56 | |
|
|
Bitcoin Rejected at $7,500; A Much Larger Drop Could Be Imminent
Bitcoin has incurred multiple bouts of bullishness over the past several days and weeks, with each rally resulting in a strong rejection that leads the cryptocurrency to fully retrace its gains. This pattern occurred again today, when BTC surged to highs of nearly $7,500 before incurring a strong and swift rejection. дальше »
2019-12-27 04:00 | |
|
|
Bitcoin Could Dump to $5,000 If This Pattern Plays Out
The consolidation for the entire month of December has continued for Bitcoin as it holds above key support. If the next moves down are similar to the previous ones however it could soon be as low as $5,000 according to one analyst. дальше »
2019-12-26 11:00 | |
|
|
Bitcoin Rallies 5% To Clear Hurdles, Bulls Aiming $8K
Bitcoin price rallied more than 5% to clear the $7,500 resistance against the US Dollar. The price is now trading in a positive zone and it could rise further above $7,700. There is a short term breakout pattern forming with resistance near $7,590 on the hourly chart of the BTC/USD pair (data feed from Kraken). дальше »
2019-12-23 09:00 | |
|
|

2018 Bitcoin Fractal Suggests Another Price Decrease on the Horizon [Premium Analysis]
The Bitcoin price has been trading in a bearish pattern but has shown curious signals of bullish momentum. The direction of the ensuing movement could possibly determine the direction of BTC’s next long-term trend. дальше »
2019-12-22 19:10 | |
|
|
Binance Coin Could Soon Begin a New Market Cycle [Premium Analysis]
The Binance Coin price has been correcting inside a bullish pattern since reaching a high of $41 on June 21. There is a significant support area at $10, which could propel the price to a breakout. дальше »
2019-12-21 07:33 | |
|
|
Ethereum (ETH) Could Dip And Rip Again, Bitcoin Turns Bullish
Ethereum is correcting lower from $135 and it is trading above $125 against the US Dollar. The price is likely to remain in a positive zone as long as it is above $120. There is a breakout pattern forming with resistance near $128 on the hourly chart of ETH/USD (data feed via Kraken). дальше »
2019-12-20 06:08 | |
|
|
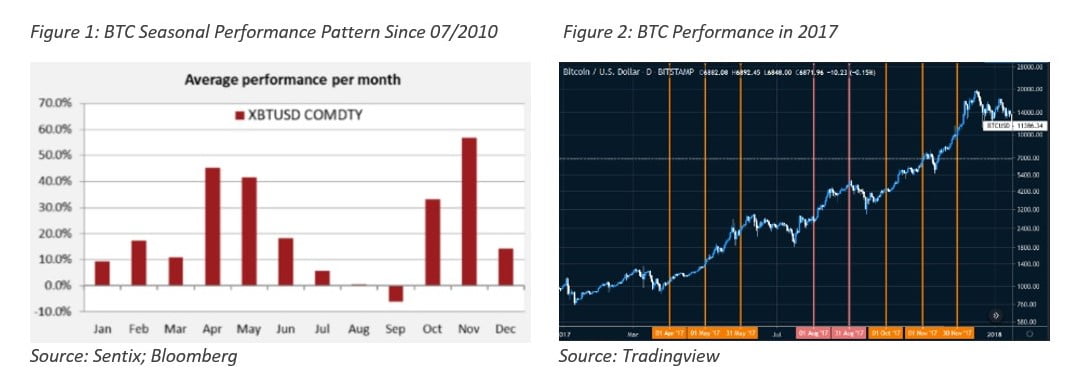
Bitcoin’s Seasonality: Doing the Right Thing at the Right Season Is a Great Art
The price of bitcoin has extended its losses to below 7000 levels as the gloomy sentiment has been looming the broader cryptocurrency markets. While the hype of the next BTC halving has been gradually building up as we are about to wrap up 2019, the seasonal pattern shows that BTC markets could be relatively calm. дальше »
2019-12-19 09:00 | |
|
|
XRP's bull flag pattern could hoist price high
XRP's price was hovering between the $0.21-$0.25 range for a long time now. A much-needed breakout to the positive side could be in the offing as XRP bulls take position to take over. The coin was traThe post XRP's bull flag pattern could hoist price high appeared first on AMBCrypto. дальше »
2019-12-9 23:30 | |
|
|
Litecoin could profit from descending channel pattern breakout
Litecoin has been trading close to its support point and despite minor surges, the silver crypto failed to post impressive rallies after August this year. Litecoin has been trading at $46.09 after The post Litecoin could profit from descending channel pattern breakout appeared first on AMBCrypto. дальше »
2019-12-9 21:35 | |
|
|
Bitcoin & Crypto Market Approaching Crucial Break: LTC, BNB, BCH, TRX Analysis
The total crypto market cap is forming a major breakout pattern with resistance near $195. 0B. Bitcoin price is slowly rising and it seems like it could climb above the $7,400 resistance. Binance coin (BNB) price is holding the $15. дальше »
2019-12-6 08:30 | |
|
|
Bitcoin’s Bart Pattern Makes Another Appearance [Premium Analysis]
The Bitcoin price just completed a Bart pattern to the downside and is in the process of completing another one. The latter could take the price to $7200 or below. On December 4, the Bitcoin price initiated a rapid upward movement, which could have been caused by a massive transfer of Tether to the OKEx […] The post Bitcoin’s Bart Pattern Makes Another Appearance [Premium Analysis] appeared first on BeInCrypto. дальше »
2019-12-5 14:12 | |
|
|
Cardano's price could face resistance at $0.039 despite falling wedge pattern
Following a brief recovery, Cardano headed for a downtrend as the month dawned. Despite significant developments on the tech front to bolster the coin's adoption, Cardano has failed to post any signifThe post Cardano's price could face resistance at $0. дальше »
2019-12-2 19:00 | |
|
|
Sub-$7000 Bitcoin Price Bloodbath Could Spiral Near $4,000, Warns Analyst
A prominent analyst weighs on a head-and-shoulders pattern that could take bitcoin to $4,000 while several indicators add credibility to it. The post Sub-$7000 Bitcoin Price Bloodbath Could Spiral Near $4,000, Warns Analyst appeared first on CCN.com дальше »
2019-11-25 13:39 | |
|
|

Bitcoin Historically Bullish After Unique Difficulty Adjustment Pattern
The most recent 2% increase in difficulty adjustments on the Bitcoin network could be definitely be seen as a negative, but a quick review of the historical chart reveals that difficulty drops followed by increases have traditionally been bullish. дальше »
2019-11-22 19:10 | |
|
|

Bitcoin Price Currently Looks Like 2016, Analyst Believes
The Bitcoin price is currently trading inside one of its most significant support areas to date. A breakdown with high volume could initiate a rapid price decrease. There is a pattern from 2016 that suggests the price will reverse near the current level. дальше »
2019-11-22 11:20 | |
|
|
Ethereum's price could recover after formation of falling wedge pattern
The Ethereum community is preparing for several developments on the network, including the Istanbul hardfork in December and Ethereum 2.0. However, despite news of such developments, not a lot of impaThe post Ethereum's price could recover after formation of falling wedge pattern appeared first on AMBCrypto. дальше »
2019-11-18 17:30 | |
|
|

Bitcoin Price Could Hit the $14k – $20k Range Around Next Halving: Analysis
Based on historical patterns, Bitcoin’s price could go through a narrow price range, soon before the block reward halving. BTC remains unpredictable, yet past analysis shows a certain trend. дальше »
2019-11-10 15:04 | |
|
|