Новости о Indicator According [ Фото новости ] [ Свежие новости ] | |

Sorry Bulls, Bitcoin Indicator That Called 50% Decline Still Flashing “Sell”
Since Bitcoin (BTC) bounced cleanly off the macro $6,400 support earlier this month, analysts have been wondering if the pain is over for the cryptocurrency market. According to two key trend indicators, which predicted previous bear markets and bull markets, the medium-term to long-term trend remains bearish, unfortunately enough. дальше »
2019-12-26 00:00 | |
|
|
Bitcoin’s “Supertrend” Flips Red as Price Fails to Surmount Low-$7,000s
According to a recent analysis done by Byzantine General, the SuperTrend indicator for the one-week Bitcoin chart has flipped red, meaning bearish, after a multi-month bullish period seen earlier this year. дальше »
2019-12-16 23:30 | |
|
|
Ethereum developer activity is seeing “parabolic” growth says analyst; will price follow?
According to data from Santiment, developer activity on the Ethereum blockchain network has seen parabolic growth as of late, rising to May 2019 levels. In May, the Ethereum price was hovering at around $260, nearly 40 percent higher than its current price of $186. дальше »
2019-11-12 14:17 | |
|
|
Technicals Lean Bullish as Massive Bitcoin Price Move Brews
Bitcoin (BTC) is about to see a massive bout of volatility, according to a long-term technical indicator. Sure, the leading cryptocurrency spiked by 42% two weeks back, surging from $7,300 to $10,500 seemingly on the news that China’s President was calling for the formal adoption of blockchain technologies. дальше »
2019-11-11 01:30 | |
|
|
Treasury Yields Rebound from Two-Week Lows Despite Manufacturing’s Deep Recession
U. S. government debt yields recovered on Friday as bond prices fell. The benchmark yield nosedived below 1. 70% on Thursday, reaching its lowest levels since Oct. 15. The U. S. manufacturing sector is in a deep recession, according to at least one indicator. дальше »
2019-11-4 00:01 | |
|
|

Bloomberg: Time to buy Bitcoin (BTC)
According to Bloomberg, for the first time since the end of 2018, there is an indicator that firmly says: time to buy bitcoin! This indicator is GTI, Global sTrength Indicator. Despite its title, GTI is not talking about power at all, but about that BTC is oversold. Right now, at $ 8,000, Bitcoin is oversold. […] дальше »
2019-10-7 16:59 | |
|
|

Bitcoin (BTC) upside down tothemoon
Beloved by tech analysts, the figure “head and shoulders down” appears on the bitcoin chart. According to these analysts, reversed head and shoulders promises explosive growth. According to the technical analysis, the ordinary head and shoulders (Head And Shoulders Top Pattern) usually serves as an indicator of a collapse. Conversely, reversed head and shoulders can […] дальше »
2019-9-3 14:30 | |
|
|
Here’s Why Ethereum (ETH) Could Rise Substantially
Ethereum could start rallying to the upside in the coming days, according to a textbook technical indicator. Prominent market analyst Jonny Moe noted Ethereum trending inside a Falling Wedge pattern, confirmed by converging trend lines, forming lower highs and lower lows. дальше »
2019-8-30 17:00 | |
|
|
Crypto Analyst: Bitcoin Indicator Resembles Mid-2016 Bullish Beginnings
Much of the crypto market may have flipped sentiment to being bearish on Bitcoin after yesterday’s dump that bled out over $20 billion from the total crypto market cap. However, according to one of the most respected crypto analysts in the space, an important trend indicator suggests that the current price action very closely resembles. дальше »
2019-8-30 01:00 | |
|
|
Bitcoin Bias Flipping to Extremely Bearish: Analyst
Trading signals for Bitcoin are turning ‘extremely bearish’ as the cryptocurrency’s wild upside of HY2019 comes close to its exhaustion. According to market analyst Chonis Trading, the moving average convergence divergence (MACD) oscillator on bitcoin’s weekly charts is looking to flip to indicate its bearish bias. дальше »
2019-8-21 17:00 | |
|
|
After Monster Crash Bitcoin Flashes Loudest ‘Buy’ Signal in 8 Months
By CCN Markets: Bitcoin plunged below $10,000 on Thursday after a violent three-day selloff. But now is not the time to panic. If history is anything to go by, now might be the best time to accumulate bitcoin. дальше »
2019-8-15 13:57 | |
|
|

Bitcoin 30-Day Volume at Record $770 Billion
Bitcoin daily trading volume hit the record high on June 26. However, the indicator is still maintaining the record level in terms of monthly volume. Bitcoin 30-Day Volume Benefits from June High While Bitcoin is heading towards breaking the support level at $9,000, the trading volume is keeping at a decent level. дальше »
2019-7-17 21:00 | |
|
|
Bitcoin Drops To $7,500 As The Digital Asset Flashes Major Sell Signal
Bitcoin after having two of its best months since the crypto boom of 2017, is now back in a downward trend. Although the current drop has been a big hit for investors, a sell signal indicates that there could still be more losses ahead. дальше »
2019-6-5 10:20 | |
|
|

Bitcoin (BTC) Could See $400,000 In The Coming Decade, Analyst Quips
Bitcoin At $400,000 According to analyst NebraskanGooner, Bitcoin (BTC) is poised for a massive rally. Gooner’s trend indicator, fittingly named “Top Goon X”, recently printed a black arrow in the weekly chart after a red. дальше »
2019-6-1 22:30 | |
|
|
Bitcoin Price Exploded in 25-Month Bull Rage the Last Time This Happened
By CCN: According to technical analyst Josh Rager, the 3-day Guppy Multiple Moving Average (GMMA) on the bitcoin price trend has turned green following bitcoin’s recent rally. The last time this technical indicator signaled a change in trend, it led to a 25-month bull run. дальше »
2019-5-28 10:23 | |
|
|
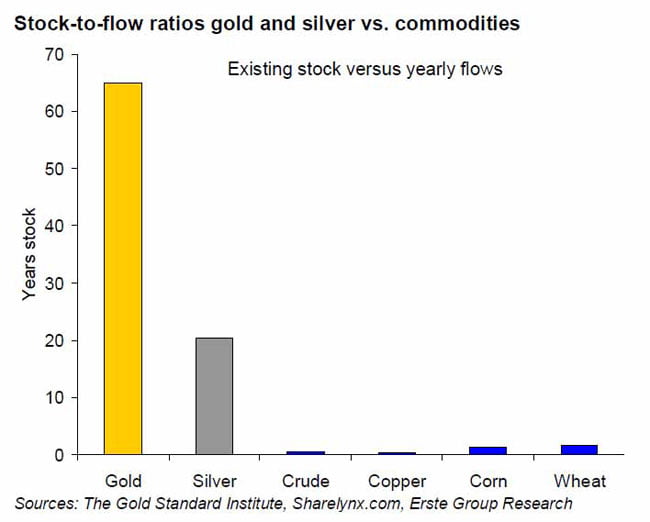
Could Bitcoin Reach $100,000 in 2020? This Indicator Says Aye
Bitcoin is about to get a lot more expensive than it is today, according to Dr. Julian Hosp. The author of ‘Cryptocurrencies Simply Explained‘ evaluated bitcoin’s future performance based on a textbook indicator that measures abundance in commodity markets. дальше »
2019-5-25 14:00 | |
|
|
Bitcoin Price Chart: Technical Indicator Gives 5th Ever Parabolic Signal
While Bitcoin price is struggling with overhead resistance at the moment and taking a much needed breather from its bullish rally that began in early April with a $1,000 green candle, the cryptocurrency may have a lot more parabolic momentum left, according to one specific technical indicator. дальше »
2019-5-21 03:01 | |
|
|
This Technical Indicator Predicts Bitcoin above $300K by 2021
The bitcoin price could discover new highs above $300,000 by 2021, according to a popular technical indicator. Dubbed as the Stochastic RSI, the indicator helps investors identify oversold and overbought conditions inside the market. дальше »
2019-5-12 19:00 | |
|
|

Renewed Market Growth Has Sparked Demand for Crypto-Backed Loans
With cryptocurrency markets back to life, hodling sounds like a smart strategy once again. Cryptocurrency owners are now more likely to pledge coins to borrow fiat if they need it, rather than sell their appreciating digital assets. дальше »
2019-5-10 05:31 | |
|
|
Bitcoin Jumps 4% to New 2019 High Boosted by $20,000 Trigger Indicator
By CCN. com: The bitcoin price has increased from $5,341 to $5,587 on Coinbase, getting close to surpassing a 2019 high at $5,594. In some crypto major markets, the bitcoin price surged past $5,600. дальше »
2019-5-3 11:51 | |
|
|

Delphi Digital's Latest Report Says Bitcoin’s Market Cycle Is Right on Track
Delphi Digital has returned with another installment of its unspent transaction output (UTXO) reports. Recalling its report from January of this year, the research firm says bitcoin’s market cycle is right on track. дальше »
2019-5-3 18:44 | |
|
|
Once in a Decade: Amazon Stock Sees Golden Cross, Bullish Indicator
By CCN: In the past 30 days, Amazon’s stock (AMZN) has increased from $1,500 to $1,926 year-to-date, surging by more than 28. 4%. The strong momentum of AMZN led a key technical indicator called the short-term 50-day moving average to surpass a long-term 200-day moving average, flashing the infamous “golden cross. дальше »
2019-5-1 18:00 | |
|
|
Bitcoin Momentum Fails, Bearishly Overbought for the First Time Since 2017
By CCN. com: According to a cryptocurrency trader, a technical indicator of bitcoin is signaling a potential downturn in the market for the first time since December 2017. The indicator, known as the Relative Strength Indicator (RSI) bearish divergence, signals a bearish downtrend and a decline in momentum. дальше »
2019-4-29 13:19 | |
|
|

Bitcoin Economic Activity Now 30% Higher Than At $20K Price
While Bitcoin transactions per day have hit a fresh 2019 high, a “better indicator” measuring transaction outputs reveals that economic activity on the BTC blockchain is currently at a record high. дальше »
2019-4-25 11:30 | |
|
|

Bitcoin (BTC) Technical Signal That Has Predicted Historical “Moons” Is Flashing
Bitcoin Looking Bullish Bitcoin may have dropped by 2% in the past 24 hours, but analysts have kept their heads up high. According to analyst Nunya Bizniz, a technical indicator used by prominent institutional trader-turned-Bitcoin. дальше »
2019-4-25 05:00 | |
|
|
Bitcoin Price: Textbook Stock Trading Indicator Forecasts 31% Rally
By CCN: The bitcoin price could attempt a runup towards $6,800 in the near-term, according to one popular stock trading indicator. Bitcoin on the Verge of a Bump-And-Run Reversal? Dubbed a Bump-and-Run Reversal (BARR), the pattern includes three crucial phases before an asset undergoes a full-blown breakout session. дальше »
2019-4-19 23:44 | |
|
|
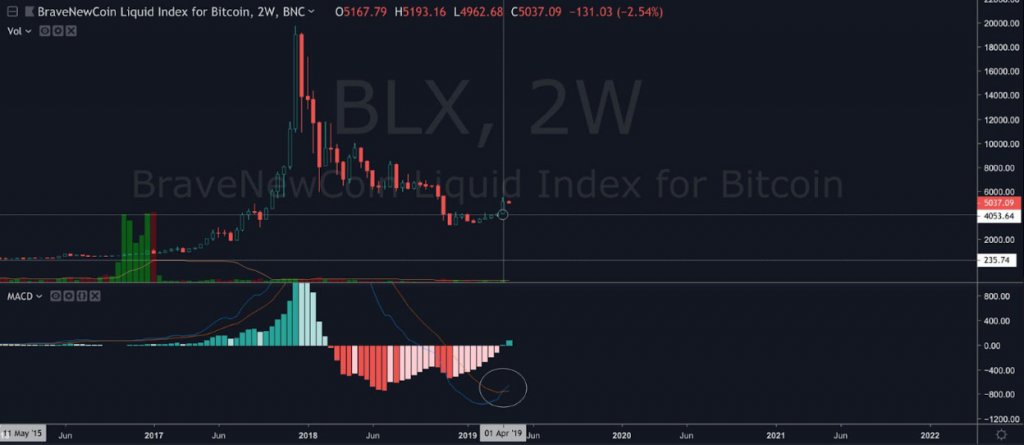
Bullish signal suggests the bottom is in for bitcoin, says technical analyst
A trading indicator in the bitcoin markets suggests the bottom may be in, according to one technical analyst. The two-week MACD of bitcoin crossed into a buy signal on Apr. 1st, the first time since May 11th, 2015, the bottom of the market before it exploded in 2016-2017. дальше »
2019-4-18 09:59 | |
|
|
‘Emotional’ Bitcoin Bulls are ‘Grasping At Straws’, Claims Bloomberg Analyst
A recent article in Bloomberg paints a less optimistic future of the crypto markets than you might typically find this week. Vildana Hajric reports that the GTI Global Strength Indicator of the Bloomberg Crypto Index, which tracks significant cryptos, has the same trends which led to its previous peak in January 2018. дальше »
2019-4-10 17:40 | |
|
|
Bitcoin Blazes Bullish in Long-Term Indicator – For the First Time Since 2015
The crypto market has begun to demonstrate signs of new momentum as bitcoin slightly recovered to over $5,200 and other major crypto assets like Ethereum and EOS recorded large gains on the day. According to trader Jonny Moe, bitcoin is close to breaking the 200-day simple moving average (SMA) cross for the first time since October 2015. дальше »
2019-4-10 13:04 | |
|
|
Data shows bitcoin most overbought since 2017: parabolic phase or impending crash?
Bitcoin is currently at its most expensive levels in 2019. According to the GTI Global Strength Indicator—a technical analysis tool that gauges intraday crypto volatility, bitcoin is currently in ‘overbought’ territory—suggesting it could be entering a “parabolic phase,” or be prepared for another downturn. дальше »
2019-4-7 11:38 | |
|
|
Crypto Market ‘Bullish’ in Wake of Bitcoin’s 20% Surge
Cryptocurrency prime dealer SFOX released its monthly volatility report this week, and while it is not all plain sailing for the crypto market the indicator clearly affirms that this week’s massive Bitcoin price rally was built on a firm foundation. дальше »
2019-4-6 17:56 | |
|
|
Bitcoin Price: Key Technical Indicator Shows BTC Surging to $5,500
Throughout the past three months, the bitcoin price has flirted with the $4,200 resistance level, often struggling to maintain momentum above the key $4,000 mark. Several traders have demonstrated concerns over the extended period of stability demonstrated by bitcoin because, in late 2018, the cryptocurrency recorded a drop of around 50 percent following three months of stagnation in the $6,300 to $6,500 range. дальше »
2019-3-24 21:30 | |
|
|
Bitcoin Price Rally Could be on Last Legs, Bloomberg Analyst Warns
A key market indicator shows that the Bitcoin price rally may be losing steam. According to Bloomberg, “Bitcoin’s Moving Average Convergence Divergence indicator has been steadily falling since mid-February. дальше »
2019-3-13 00:30 | |
|
|
Taking Long Positions in Bitcoin is Comfortable: Former BoA Trader
Taking long positions in Bitcoin should be comfortable for traders, according to Naeem Aslam. The former equity trader with the Bank of America said Thursday that he would purchase bitcoin if the crypto-asset compliments a crucial technical indicator. дальше »
2019-3-11 11:14 | |
|
|

Bitcoin [BTC]’s Price Approaches Oversold Territory, a Short-term Rally Could Be Ahead
According to a new Bloomberg report, technical indicators are showing an upside rally for Bitcoin could be near as the coin appears to have bottomed out. The GTI Global Strength Technical Indicator suggests that the coin is currently near oversold levels, which could signal a good entry point for investors. дальше »
2019-1-23 16:29 | |
|
|

Cryptocurrencies Are Flashing a Buy Signal, Reports Bloomberg
Cryptocurrency enthusiasts may have a reason to rejoice as the technicals are flashing a buy signal according to a technical analyst at Bloomberg. Positive signs from market technicals could mark the beginning of a new crypto bull run. дальше »
2019-1-3 16:30 | |
|
|
Why is Volume an Important Investment Indicator for Crypto Traders Over RSI and Moving Averages?
There are many indicators that professional traders use to operate in the crypto market. When they combine their analysis with indicators, it is possible for them to have better results in predicting price movements or market directions. дальше »
2018-12-24 21:27 | |
|
|
Goldman Sachs Stock Market Indicator Goes ‘Flashing Red’ to Predict a Collapse as Bitcoin Speculators Look for a Boost
Two matters are currently top of the discussions within the cryptocurrency community; the upcoming Bitcoin Cash hard fork and the SEC’s impending decisions on Bitcoin ETFs. The approval of Bitcoin ETFs is expected to cause a massive influx of institutional investors into the crypto market. дальше »
2018-11-14 23:08 | |
|
|

Key Technical Indicator Shows Bitcoin Price Poised for ‘Santa Claus Rally’
The crypto market continues to endure a difficult 2018 after increasing posting astronomical gains in 2017. However, signs are beginning to emerge that Bitcoin price may set for another rally before 2019. дальше »
2018-11-8 14:00 | |
|
|

Is the Bitcoin Sell-Off Over? Technical Signs and Major Investors Believe so
Earlier this week, Lily Katz at Bloomberg reported that the GTI VERA Convergence Divergence Indicator suggests the Bitcoin downtrend is over. Experts have echoed a similar sentiment, expecting the bear market of the dominant cryptocurrency to come to an end in the upcoming months. дальше »
2018-8-26 15:23 | |
|
|

CNBC Tweets Have Been a Contrarian Bitcoin Price Indicator With 95% Accuracy
According to research from prominent cryptocurrency trader Jacob Canfield, who plotted out his findings against a BTC price chart on the popular charting site TradingView, CNBC’s tweets can be used as a contrarian Bitcoin price indicator with as much as 95% accuracy. дальше »
2018-8-25 17:00 | |
|
|

Bitcoin Selloff Could be Over, Says this Technical Indicator
The massive Bitcoin selloff that has characterized most of the market in 2018 might soon be at an end based on the data from a technical indicator. If correct, the top-ranked cryptocurrency may experience a substantial price rally in the last quarter of the year. дальше »
2018-8-24 19:10 | |
|
|