Новости о Bullish Sell [ Фото новости ] [ Свежие новости ] | |

Compound (COMP) price remains in a bull market. Here are the important support and resistance levels
In less than two months, Compound (COMP) price has advanced from $80 above $200 and for now, there is no fear of the bear market. Rising above $220 supports the continuation of the bullish trend, but if the price falls below $180, it would be a strong “sell” signal. дальше »
2021-1-11 14:47 | |
|
|

Is Aave (AAVE) a buy or sell in January?
Aave (AAVE) has advanced from $26 above $120 since the beginning of November, and the current price stands around $116. The primary trend of this cryptocurrency remains bullish, and for now, there is no signal of the trend reversal. дальше »
2021-1-10 22:38 | |
|
|
Whales Sell Down Bitcoin Rally: Why This Is Fundamentally Bullish For Crypto
Bitcoin price is now below $18,000 and the distance from the all-time high set just weeks ago is increasing by the day. The incredible rally of 2020 might have now come to an end, with the tipping point caused by some of the largest cryptocurrency whales offloading their coins. дальше »
2020-12-11 18:30 | |
|
|

At $13,800 More Than 97% of Bitcoin Ever Bought Could be Sold at Profit
At current prices, investors who bought bitcoin at almost any time in history can sell at a profit today. Recent bullish price action has the leading digital asset once again testing resistance around $14,000. дальше »
2020-11-5 22:21 | |
|
|

Bitcoin's drop to $10,000 isn't reason enough to sell
It feels weird writing about Bitcoin's drop to $10,000 since usually, the headlines are all about Bitcoin's rise above $10,000. However, with the market as bullish as it is now, a drop to $10,000 seemThe post Bitcoin's drop to $10,000 isn't reason enough to sell appeared first on AMBCrypto. дальше »
2020-9-7 16:00 | |
|
|
Sorry Bulls: Bitcoin Prints Perfect Sell Setup Last Seen at February’s $10k Top
After weeks of bullish price action, Bitcoin finally topped $10,000 today, rallying as high as $10,100 on the back of an influx of buying pressure. Many say that this recent move sets the stage for even greater growth, but a trader recently argued that BTC printed a “perfected” sell setup. The setup was the exact... дальше »
2020-5-8 12:00 | |
|
|

Analyst Warns Reopening the Economy May Be a ‘Sell the News’ Event
Could financial markets end up tanking when the economy reopens? Although it seems counterintuitive, one analyst believes it just may happen. Financial markets have been steadily rallying, but many have been skeptical that this bullish momentum will continue. дальше »
2020-4-17 16:15 | |
|
|

Analyst Claims Miner Capitulations Are Happening As We Speak
Although bullish momentum is high, one analyst is saying miner capitulations are creating a strong divergence and hidden sell signal. There have been ongoing discussions around how miners will respond to the coming halving event. дальше »
2020-4-7 07:15 | |
|
|
Bitcoin has all 5 technical and fundamental elements for a proper full-blown rally
The Bitcoin price is up 45 percent in the past month and a half. Historically, such an extended rally warrants a pullback. But, BTC now has all five elements for an extended upside movement. Two key technical elements: lower time frame sell absorption, higher time frame bullish structure Throughout the past 43 days, the Bitcoin […] The post Bitcoin has all 5 technical and fundamental elements for a proper full-blown rally appeared first on CryptoSlate. дальше »
2020-1-30 11:04 | |
|
|
Tesla Stock Will Sell Off Hard If Earnings Report Disappoints, Says CNBC’s Jim Cramer
Coinspeaker Tesla Stock Will Sell Off Hard If Earnings Report Disappoints, Says CNBC’s Jim CramerVery soon the latest earning report from Tesla will be revealed. While most of the market is bullish, Jim Cramer says that there is a possibility that the results may disappoint investors. дальше »
2020-1-29 16:18 | |
|
|
Bulls Beware: Bitcoin’s Response to This Key Level May Be a Grave Sign
Bitcoin and the aggregated crypto markets have had a bullish start to 2020, with BTC surging from its recent lows of $6,800 that were set when bulls attempted to spark a sharp sell off earlier this week. дальше »
2020-1-6 20:30 | |
|
|
Bitcoin Taps Lower Boundary of Bullish Channel; Break Below Could Spark Massive Sell Off
Bitcoin (BTC) has been caught in the throes of immense volatility over the past several days and weeks, with the cryptocurrency recently dropping to lows of $6,500 before posting a sharp bounce to $7,400. дальше »
2019-11-27 00:00 | |
|
|
Lyft Co-Founder Talks ‘Undervalued’ Stock. Insiders Then Make Millions Hitting Sell
Just last week Lyft co-founder was bullish on the stock. The sell-off… The post Lyft Co-Founder Talks ‘Undervalued’ Stock. Insiders Then Make Millions Hitting Sell appeared first on CCN.com дальше »
2019-11-25 16:28 | |
|
|
Вилли Ву: биткоин впервые приближается к халвингу с медвежьим настроем
Криптоаналитик Вилли Ву отметил, что впервые в истории халвинг биткоина приближается на фоне медвежьей расстановки сил. NEVER gone into a halvening in BEARISH price action, miners already capitulating adding sell volume. дальше »
2019-11-20 14:16 | |
|
|
Bullish Sentiment Implies Bitcoin Price Needs to See Bigger Flush
If you’ve been on Crypto Twitter at all, you know of the Bitcoin “HODL” meme. For those living under a rock, here’s a quick explainer: HODL, a misspelling of “hold” first found on the (in)famous BitcoinTalk forum, has become a battle cry for diehard BTC investors, who believe it is irrational to sell the asset. дальше »
2019-11-13 15:00 | |
|
|
Bitcoin Futures curve steepening as Bakkt traders remain bullish
According to Skew markets' recent report, the Futures curve for Bitcoin Futures contracts is steepening. Futures contracts are obligations between traders to either buy or sell a certain number of uniThe post Bitcoin Futures curve steepening as Bakkt traders remain bullish appeared first on AMBCrypto. дальше »
2019-11-7 19:00 | |
|
|

Bitcoin Price Could Drop Down To $7000; Diamond Top Breakdown Confirms Right Shoulder
Bitcoin price continues to free-fall after a failed bullish rally. New signals and a breakdown of two confirmed patterns point to bearish downside targets in the low $7,000 range. Bitcoin Forms Elusive Diamond Top, Signaling a Deep Drop On Friday, October 18, Bitcoin price set a higher low at roughly $7,800, signaling that bearish sell pressure may be waning. дальше »
2019-10-24 20:34 | |
|
|
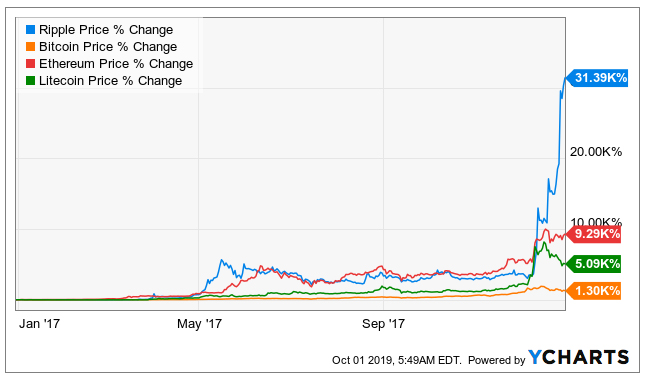
Should I Buy and Sell XRP in 2019?
Coinspeaker Should I Buy and Sell XRP in 2019?This piece answers the question “should I buy and sell Ripple in 2019?” by providing objective analysis on the bullish and bearish cases for the cryptocurrency.Should I Buy and Sell XRP in 2019? дальше »
2019-10-4 14:09 | |
|
|
WAVES Price Prediction Today: Daily (WAVES) Value Forecast – July 2
The short and medium-term outlook is in a bearish trend. Traders may look to sell at bullish exhaustion areas. WAVES/USD Medium-term Trend: Bearish Supply zones: $3. 00, $4. 00, $5. 00 Demand zones: $1. дальше »
2019-7-2 12:32 | |
|
|
QTUM Price Prediction Today: Daily (QTUM) Value Forecast – June 18
The short and medium-term outlook is in a bearish trend. Traders may look to sell at key areas at bullish exhaustion areas. QTUM/USD Medium-term Trend: Bearish Supply zone: $5. 00, $5. 50, $6. 00 Demand zone: $2. дальше »
2019-6-18 09:33 | |
|
|

Bitcoin Price Analysis: Bullish Market Structure Upheld Following Strong Sell Off
Summary:Although we saw a strong sell off yesterday, the bullish market structure has yet to be violated. The weekly support has been confirmed for the time being and our parabolic advance is still intact. дальше »
2019-6-1 23:51 | |
|
|
Trade Recommendation: (Zcash)ZEC/BTC – 104% profit potential
Coin: ZEC/BTC Time frame: 4-8 weeks Exchange: Binance Current Price: 0. 011 BTC Buy Zone: 0. 01-11 BTC Sell Zone: 0. 017 – 0. 022 BTC Profit Potential: upto 104% Time frame: 4-8 weeks Technicals and Growth Factor ZEC/BTC is showing bullish momentum on daily chart, There is a bullish candlestick arrangement since last few days. дальше »
2019-5-30 14:21 | |
|
|
BlockFi Adds Gemini Dollar Stablecoin Support
Crypto lender BlockFi is rolling out support for the gemini dollar (GUSD) stablecoin, claiming an expected initial annual percentage yield (APY) of 6. 2 percent for non-U. дальше »
2019-5-30 19:44 | |
|
|

Bitcoin Price Analysis: Strong Selling With Weekly Level Getting Tested
Summary:The market is seeing a current rejection of the weekly level outlined in 2018’s bull market. The zone between $8,300 and $8,400 has a strong point of interest in the previous bear market and we are currently seeing high levels of supply surface as people take profit. дальше »
2019-5-21 00:46 | |
|
|
BTC May Have Dropped Because of a Sell Wall Placed by a Manipulator, However T.A Shows it is Still Bullish
The recent BTC Bullrun increased the hype not only around this crypto but also around the rest of the altcoins. However, although the technical indicators were optimistic, BTC experienced a sharp drop of more than. дальше »
2019-5-18 07:51 | |
|
|
Crypto Bulls and Bears Wrestle on What Comes Next for the Bitcoin Price
By CCN: Many in the crypto community remained calm and banded together despite the steep drop in the bitcoin price on the heels of an otherwise incredibly bullish month. Bitcoin’s value was slashed by approximately $21 billion in the last 24 hours, with the BTC price currently holding above the $7,000 threshold. дальше »
2019-5-18 04:00 | |
|
|
Why the Market Slump Has Not Damaged Confidence In Bitcoin
Following a fantastic week for Bitcoin, which peaked at around $8,300, the inevitable market slump has happened. Analysts have attributed this to large sell orders placed on Bitstamp. But despite the loss of momentum, the sentiment remains bullish, which goes to show that confidence in Bitcoin is as strong as it has ever been. дальше »
2019-5-17 14:45 | |
|
|
Bitcoin Price Analysis: Bull Trend Continues as Market Marches To $6K Level
Summary:Bitcoin’s strong uptrend resumes as, once again, the market has claimed new highs in the $5,900 zone. Our market structure remains bullish as we have consistently created higher highs and higher lows. дальше »
2019-5-8 00:58 | |
|
|

Delphi Digital's Latest Report Says Bitcoin’s Market Cycle Is Right on Track
Delphi Digital has returned with another installment of its unspent transaction output (UTXO) reports. Recalling its report from January of this year, the research firm says bitcoin’s market cycle is right on track. дальше »
2019-5-3 18:44 | |
|
|
Bitcoin Price Analysis: Short Squeeze Imminent as Bearish Pressure Weakens
Summary:Following unconfirmed claims by the NYC Attorney General regarding Bitfinex and Tether’s insolvency, the bitcoin market had a knee jerk reaction that caused us to retest macro support. дальше »
2019-5-1 01:32 | |
|
|
Survey Says Sell? Just 43% Believe ‘Golden Cross’ is Bullish for Bitcoin Price
By CCN: Not everyone is convinced that Bitcoin’s highly-touted “golden cross” is a bullish signal for the world’s largest cryptocurrency. Almost 25% of Crypto Investors Believe Golden Cross is Bearish for Bitcoin According to a Twitter survey conducted by crypto bull Thomas Lee, 24% of Crypto Twitter inhabitants believe that the signal, which typically hints at a bull run ahead, is a trap and that it is time to unload some Bitcoin. дальше »
2019-4-26 18:37 | |
|
|
Bitcoin Price Analysis: Reaccumulation Breakout Hints at Bullish Continuation
Summary:Bitcoin clearly broke upward out of reaccumulation trading that had spent three weeks consolidating sideways. The market has begun to drift into a zone of supply between the $5,700 and $6,000 levels. дальше »
2019-4-24 22:22 | |
|
|

Adamant Capital: BTC Price Bottom Is Likely In, Accumulation Phase Has Begun
Bitcoin fund Adamant Capital is convinced that the bottom of the bear market is in, and true to its name, the firm has laid out an unwavering case for this position with some persuasive hard data and fundamental analysis. дальше »
2019-4-20 22:59 | |
|
|
Why Uber’s $100 Billion Valuation is Wildly Bullish for Lyft Stock
Uber’s decision to value itself at $100 billion rocked Lyft stock on Wednesday, causing the embattled rideshare company’s shares to plunge as far as 10%. Contrary to the prevailing narrative, however, a strong Uber IPO would be wildly bullish for Lyft shares. дальше »
2019-4-12 18:08 | |
|
|
Top 10 Altcoins to buy in april
Bitcoin is back to 5000$, Sentiments has turned in bullish, New capital will soon follow in alt-coin markets. Its good time to buy some altcoins and sell for big profits later. We are back with our popular top 10 altcoins list after a brief long time. дальше »
2019-4-5 17:16 | |
|
|
TRON Price Prediction Today: Daily (TRX) Value Forecast – April 4
The bears are in control of both the short and medium-term outlook. Traders may look to sell at pullback areas with bearish reversal candlestick pattern as confirmation. TRX/USD Medium-term Trend: Bearish Supply zones: $0. дальше »
2019-4-4 20:21 | |
|
|
Bitcoin Price Analysis: Upward Drift Continues Following Established Macro Support
Since mid-February, the bitcoin market has continued to drift upward toward a band of strong, macro resistance (shown below as a red band). This slow, drift upward marks our fourth test of the resistance zone and, unlike the three prior tests, our rejection of the level has shown a weakness on the side of the bears:Figure 1: BTC-USD, Daily Candles, Fourth RejectionIf we compare the three prior rejections (labeled 1, 2 and 3), we see that the move into this resistance level was violent — and had equally violent rejections. дальше »
2019-3-29 02:21 | |
|
|
Bitcoin Price Analysis: Slow Upward Drift Tests Market Supply
A slow, grinding upward drift has been the name of the game for bitcoin’s market over the last few weeks. The upward drift is bringing us slowly to a level that was previously rejected violently:Figure 1: BTC-USD, Daily Candles, Upward DriftOur third rejection of the red resistance level shown above brought the market into a test of macro support in the mid-$3,000s. дальше »
2019-3-23 01:23 | |
|
|
Bitcoin Price Analysis: Slow Grind Could Lead to Short Squeeze
Last Friday, we discussed a macro resistance level bitcoin would likely test. The level was tested three times prior and immediately rejected. Now, for the fourth time, we find ourselves situated above the level as we wait to see if our support holds:Figure 1: BTC-USD, Daily Candles, Fourth Test of Macro ResistanceThe first three attempts to hold support above the black, broken resistance have been stifled with relatively high amounts of volume. дальше »
2019-3-19 01:17 | |
|
|
Bitcoin Price Analysis: Could Three Times Be the Charm for This Resistance Level?
Bitcoin remains in its tightly coiled range as the market continues its sideways trend for the third week in a row. While macro support has been tested three times recently, we have yet to test the overhanging macro resistance:Figure 1: BTC-USD, Daily Candles, Narrow RangeThe blue zone outlined above shows a very strong zone of support that, over the last few weeks, has seen three strong tests and has led to a slowly upward-drifting market consolidation. дальше »
2019-3-16 01:56 | |
|
|
Bitcoin Price Analysis: Low Time Frames Show Signs of Life Amid Weekly Tests
Bitcoin continues to coil tightly within its range-bound market as the bulls and bears fight it out to see which is most dominant. On the lower time frames (TF), bitcoin is managing to find support:Figure 1: BTC-USD, 2-Hour Candles, Low TF SupportThe zone outlined by the green line in Figure 1 represents local support that has kept the market afloat for the last week and a half. дальше »
2019-3-13 22:26 | |
|
|
IOTA (MIOTA) Long-term Price forecast- March 2
The bears are in control of the long-term outlook. Traders may look to sell with bearish reversal candlestick pattern at pullback areas. IOT/USD Long-term Trend -Bearish Supply zone: $0. 6000, $0. 7000, $0. дальше »
2019-3-2 22:12 | |
|
|

Litecoin Price Reclaims the $47 Level yet Sell Pressure Seems to Intensify
There is still a lot of uneasy momentum keeping the cryptocurrency markets in its grip right now. One particular market successfully bucking the trend is Litecoin. This popular altcoin is slowly turning bullish, which can be seen from its current short-term Litecoin price increase. дальше »
2019-3-1 11:16 | |
|
|
Bitcoin Price Analysis: Keep an Eye Out for a Close Above the Current High
Shortly after falling from its test of the low $4,000s, bitcoin managed to find support in the mid $3,500s. This has proven to be a relevant level over the last few months, and finding support here would be a sign of relatively strong demand:Figure 1: BTC-USD, Daily Candles, Local SupportThe high candle spread rejection following our test of the low $4,000s was an indication that we had strong levels of supply left in the market, but for the time being we are holding support. дальше »
2019-3-1 03:44 | |
|
|
Bitcoin Price Analysis: Bullish Rejection Wipes Out Bitcoin’s Weekend Gains
Over the weekend, a strong rally was stifled by an even stronger rejection as the bitcoin market was shoved into a band of overhanging resistance. This band of resistance has been mentioned several times in our analyses over the last few weeks as it has proven impossible to overcome for the time being:Figure 1: BTC-USD, Daily Candles, Failed BreakoutThis run to the low $4,000s coincided with a breakout of a rather large symmetrical triangle consolidation shown above. дальше »
2019-2-26 02:42 | |
|
|