2025-8-17 13:00 |
Bitcoin’s price has recently experienced a drop from its all-time high (ATH), signaling a potential shift in market conditions. This decline, while seemingly typical, may signal underlying concerns about future volatility.
Historical cues suggest that a volatility explosion could be on the horizon, prompting key holders to turn neutral.
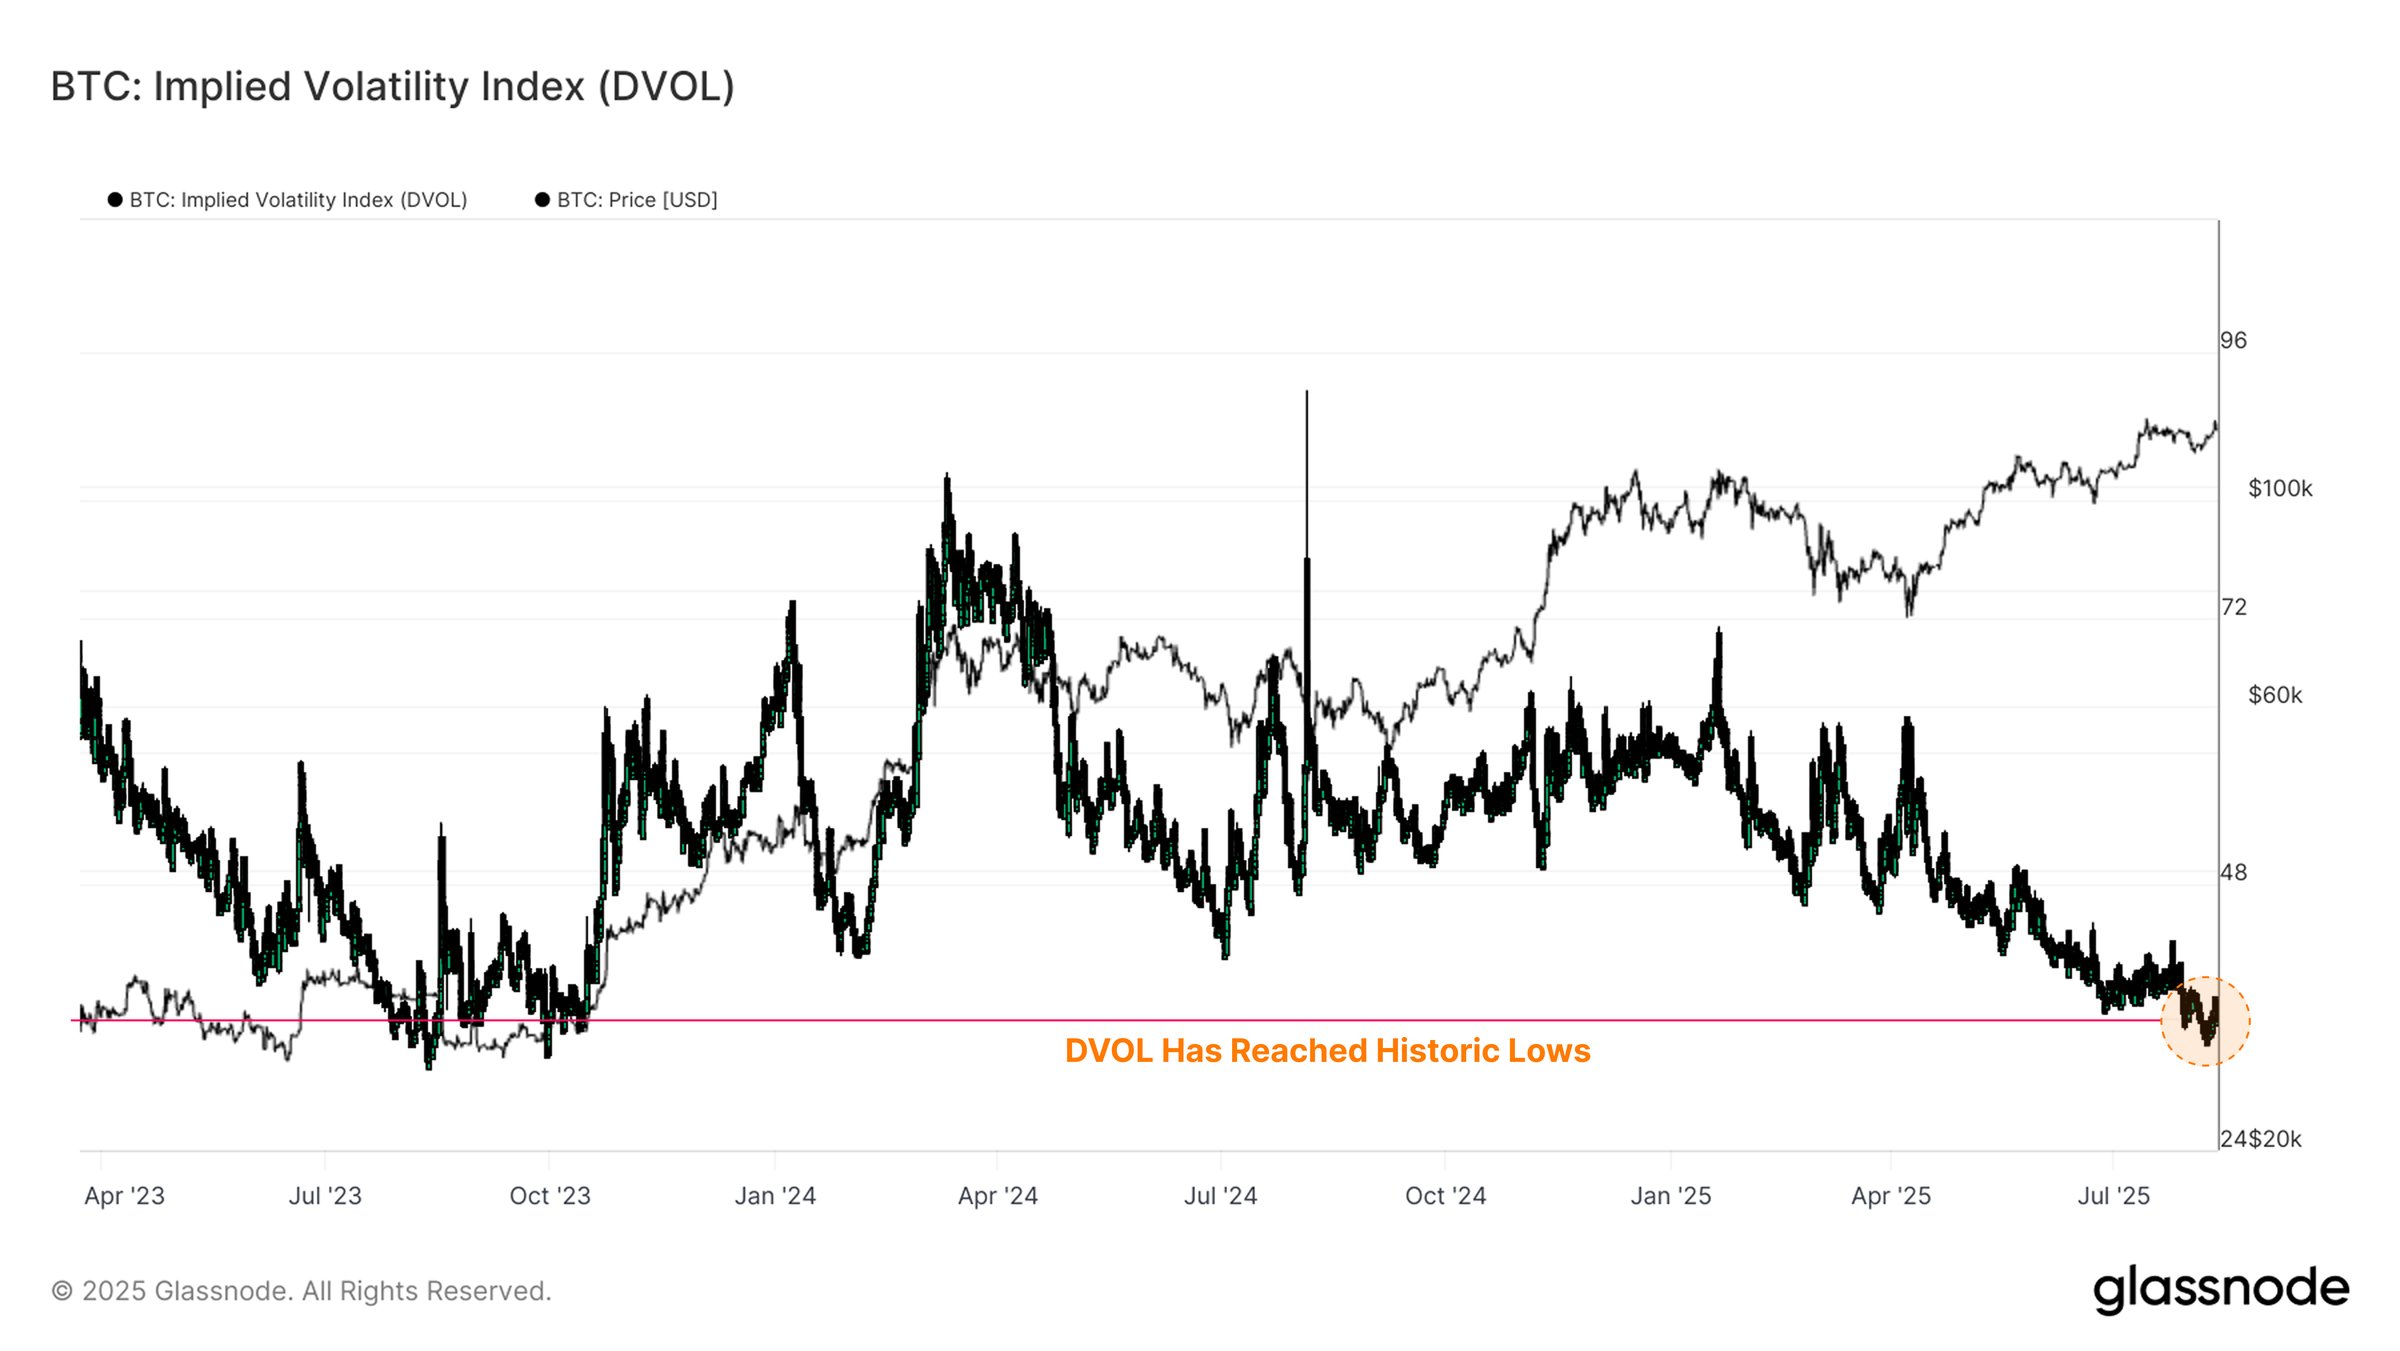
Bitcoin is Facing The Calm Before The StormThe Bitcoin DVOL index, which tracks the volatility of the asset, is at historically low levels. Only 2.6% of days have experienced lower values, indicating extreme complacency in the market. This suggests that investors are not hedging against potential downturns, which could lead to significant price movements if unforeseen events trigger volatility.
DVOL measures expected price fluctuations over the coming month, and the current low levels indicate a relaxed outlook from traders. However, this calm could be fleeting, as volatility shocks often follow periods of complacency. If an unexpected market event occurs, Bitcoin could see rapid price swings, potentially catching investors off guard.
For token TA and market updates: Want more token insights like this? Sign up for Editor Harsh Notariya’s Daily Crypto Newsletter here.
Bitcoin DVOL Index. Source: GlassnodeThe overall macro momentum of Bitcoin shows a marked shift in investor behavior. The HODLer Net position change has slowed, signaling reduced activity from long-term holders (LTHs). Although LTHs had begun accumulating at the beginning of the month, this buying trend paused, likely due to the prevailing uncertainty in the market.
Despite the lack of new buying activity, the absence of selling suggests a degree of optimism among these holders. They appear to be waiting for a clearer market direction before making their next move. This suggests that LTHs are cautious but expect that any volatility spike could eventually lead to a price increase, keeping their positions intact for now.
Bitcoin HODLer Net Position Change. Source: Glassnode BTC Price Can Hold Its SupportBitcoin’s price had shown an upward trend throughout the month, but this momentum faltered in the last 24 hours, with BTC falling to $117,305. This decline occurred as the price slipped below the established uptrend line, signaling a shift in market sentiment.
If investors maintain their positions during the expected volatility surge, Bitcoin could stabilize above $117,000. This would open the door for a potential push toward $120,000, turning it into support and allowing further upside movement.
Bitcoin Price Analysis. Source: TradingViewHowever, if investor sentiment turns bearish and selling increases in response to volatility, Bitcoin could face a significant drop. In this case, the price may fall through the $115,000 support level, potentially reaching as low as $112,526. This would wipe out the gains seen in August, invalidating the bullish outlook.
The post Historic Bitcoin Indicator Signals Huge Volatility Spike – Where is BTC Price Headed? appeared first on BeInCrypto.
origin »Bitcoin price in Telegram @btc_price_every_hour
Inverse Bitcoin Volatility Token (IBVOL) на Currencies.ru
|
|