Here’s Why Bitcoin Breaking Higher Now Would Trigger a Massive Move

Here’s Why Bitcoin Breaking Higher Now Would Trigger a Massive Move
фото показано с : newsbtc.com

2020-10-18 13:00

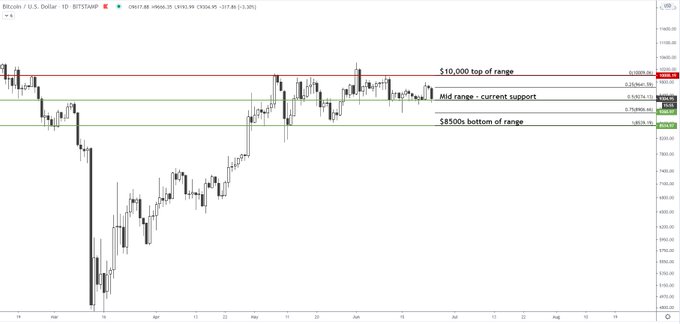
While Bitcoin has seen strong volatility on a day-to-day and week-to-week basis, it is flat on a macro scale. The crypto-asset has basically traded in the same $3,000 range for five months now. This has allowed macro volatility indicators to subside to critical historical points.

Volatility analysis by one fund manager in the space suggests that when a breakout happens, it will be explosive. He thinks it will be so explosive, in fact, that Bitcoin could hit $20,000 in three months if it attempted to break higher now.

Related Reading: Here’s Why Ethereum’s DeFi Market May Be Near A Bottom Next Bitcoin Breakout Likely to Be Explosive

Bitcoin’s next macro breakout is likely to be explosive, according to an analysis by crypto fund manager Mohit Sorout. Sorout is a founding partner of Bitazu Capital.

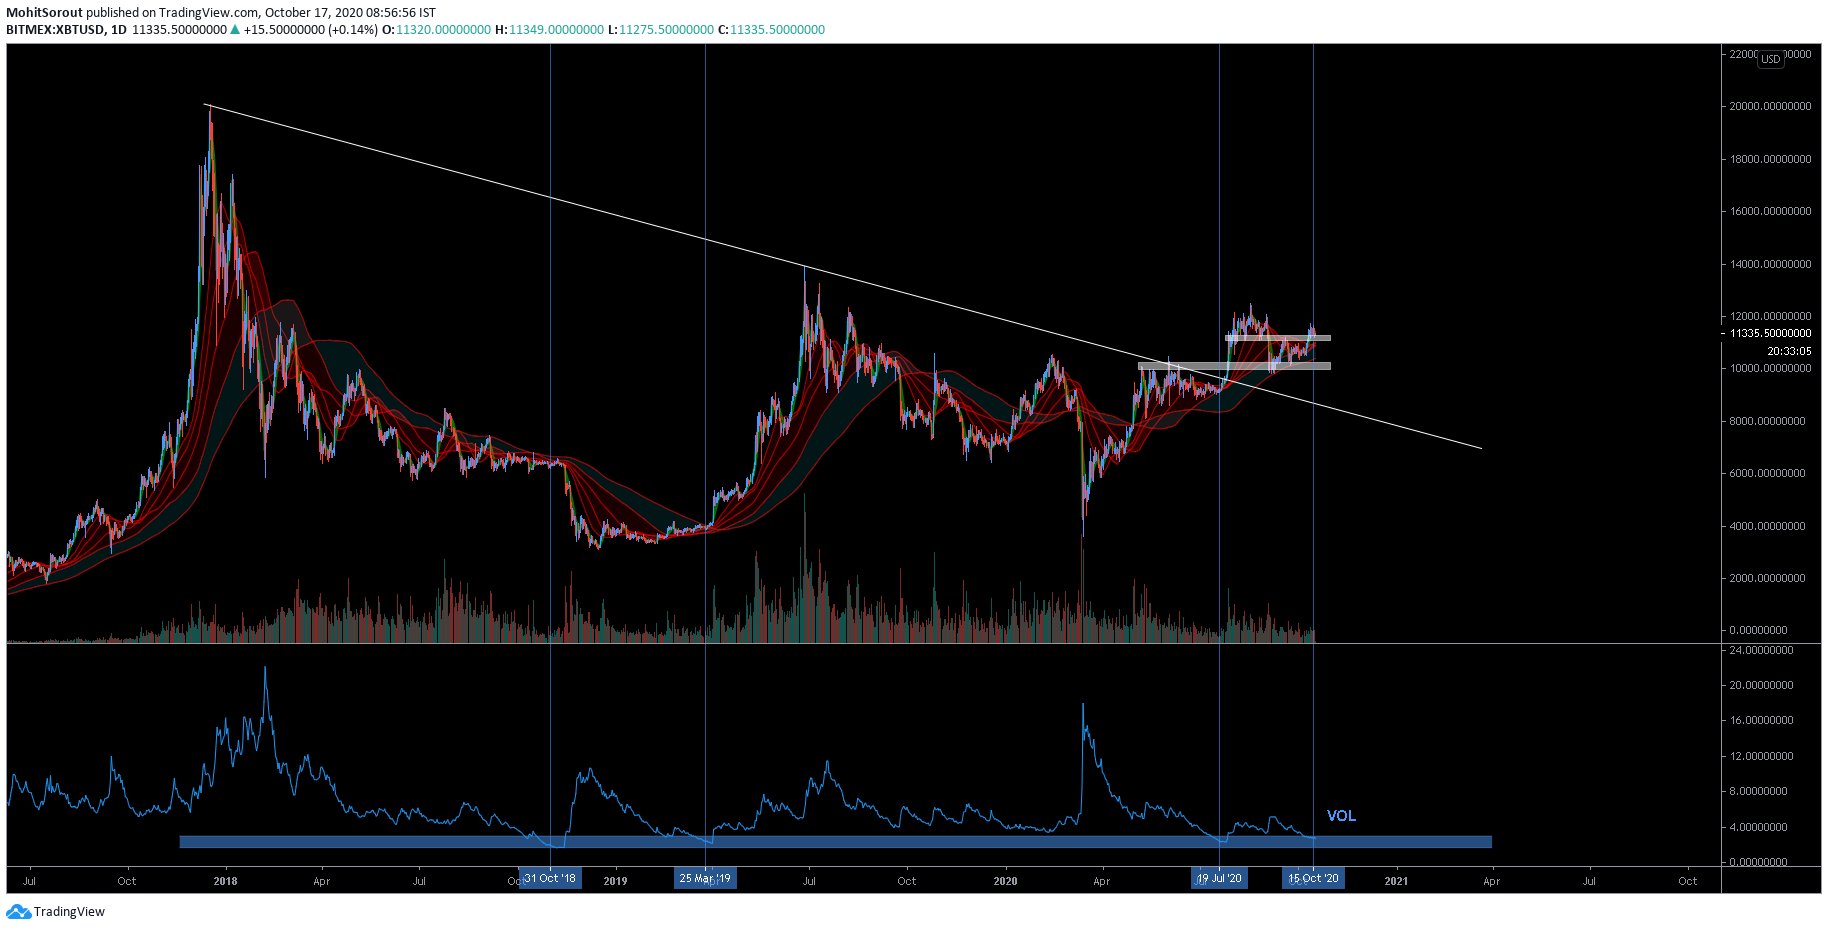
He recently shared this chart below, which shows that on a macro basis, Bitcoin’s volatility is extremely low. In fact, it’s reaching lows seen rarely in BTC’s history, with these levels only occurring approximately once a year.

This is neither bearish nor bullish in its own right.

However, if Bitcoin breaks higher, historical trends indicate that the responding move should be one that is explosive. Each rally and crash after volatility was this low historically was explosive: for one, prior to the crash from $6,500 to $3,200, Bitcoin macro volatility was this low.

This suggests that should BTC break higher here, it will rip higher to new year-to-date highs:

“Calm before the storm. If $BTC was to breakout today, it would most probably reach its previous ATH of $20k within 3 months.”

Chart of BTC's price action voer the past few years with a volatility analysis by crypto trader Mohit Sorout. Source: BTCUSD from TradingView.com Related Reading: Tyler Winklevoss: A “Tsunami” of Capital Is Coming For Bitcoin Fundamental Analysts Agree

Fundamental analysts agree

Dan Tapiero — the co-founder of DTAP Capital, Gold Bullion International, and other companies — recently said that Bitcoin could rapidly surge higher in the years ahead:

“Tremendous long term Log Chart of #Bitcoin projects up 5-10x on this run. Just breaking up NOW. Should last a few years as 2.5yr consolidation is fantastic base for catapult up. Break of old highs will have explosive follow through. Time to sit and be patient.”

This has been echoed by Vinny Lingham, CEO of Civic. He said that BTC could appreciate by 200% to 400% in the coming 12 months as macro trends align in BTC’s favor.

Related Reading: 3 Bitcoin On-Chain Trends Show a Macro Bull Market Is Brewing Featured Image from Shutterstock Price tags: xbtusd, btcusd, btcusdt Charts from TradingView.com Here's Why Bitcoin Breaking Higher Now Would Trigger a Massive Move

Similar to Notcoin - TapSwap on Solana Airdrops In 2024

origin »

Inverse Bitcoin Volatility Token (IBVOL) на Currencies.ru

$ 8561.89 (+0.01%)
Объем 24H $3.345k
Изменеия 24h: 1.91 %, 7d: 3.72 %
Cегодня L: $8561.89 - H: $8561.89
Капитализация $0 Rank 3165
Цена в час новости $ 10729.87 (-20.21%)

volatility macro bitcoin crypto-asset range basically same

volatility macro → Результатов: 25


Analyst: Bitcoin Looks Exactly As It did Prior to 2017’s 2,000% Rally

Multiple analyses have shown that Bitcoin looks primed to see a macro rally despite the ongoing uncertainty and lack of volatility. Related Reading: BTC Just Confirmed a Signal That Preceded Historical 5,000% Rallies Bitcoin Looks Extremely Similar to the Start of Previous Macro Rallies According to a cryptocurrency trader, the simple chart below explains why he […]

2020-7-19 13:00


Фото:

These 2 Trends Shows that Wall Street is in a Bitcoin Buying Frenzy

Bitcoin has been subjected to unprecedented turbulence throughout the past few months, declining to lows of $3,800 before rocketing to highs of $10,500 This volatility hasn’t been enough to thwart large market players from foraying into the digital asset Macro investor Paul Tudor Jones has been one of the first traditional investors to publicly profess his interest in BTC, but data shows that he isn’t the only one on Wall Street who is buying Bitcoin […]

2020-5-29 02:00


Фото:

Ethereum’s Macro Price Structure is Flashing Warning Signs; Things to Consider

The bear-favoring volatility seen by the aggregated crypto market yesterday has once again caused Ethereum to decline beneath the $200 price level The cryptocurrency is now flashing signs of growing weakness as multiple moving averages begin invalidating all of ETH’s macro bullishness One analyst believes that this present technical weakness could lead ETH to move back towards its yearly open Ethereum saw a sharp decline yesterday alongside Bitcoin and the aggregated crypto market. After tapping […]

2020-5-16 23:00


Фото:

Bitcoin Price Analysis: Upward Drift Continues Following Established Macro Support

Since mid-February, the bitcoin market has continued to drift upward toward a band of strong, macro resistance (shown below as a red band). This slow, drift upward marks our fourth test of the resistance zone and, unlike the three prior tests, our rejection of the level has shown a weakness on the side of the bears:Figure 1: BTC-USD, Daily Candles, Fourth RejectionIf we compare the three prior rejections (labeled 1, 2 and 3), we see that the move into this resistance level was violent — and had equally violent rejections.

2019-3-29 02:21


Фото:

Bitcoin Price Analysis: Slow Upward Drift Tests Market Supply

A slow, grinding upward drift has been the name of the game for bitcoin’s market over the last few weeks. The upward drift is bringing us slowly to a level that was previously rejected violently:Figure 1: BTC-USD, Daily Candles, Upward DriftOur third rejection of the red resistance level shown above brought the market into a test of macro support in the mid-$3,000s.

2019-3-23 01:23


Фото:

Bitcoin Price Analysis: Keep an Eye Out for a Close Above the Current High

Shortly after falling from its test of the low $4,000s, bitcoin managed to find support in the mid $3,500s. This has proven to be a relevant level over the last few months, and finding support here would be a sign of relatively strong demand:Figure 1: BTC-USD, Daily Candles, Local SupportThe high candle spread rejection following our test of the low $4,000s was an indication that we had strong levels of supply left in the market, but for the time being we are holding support.

2019-3-1 03:44


Фото:

Bitcoin Price Analysis: Strong Move Likely Following Tightly Coiled Market

Days and days of sideways consolidation and tightening volume has been the name of the game for the bitcoin market. A narrow range of $200 has caused a weeks worth of activity to coil and consolidate in preparation for bitcoin’s next move:Figure 1: BTC-USD, Daily Candles, Narrow RangeThe figure above shows just how narrow the range has been over the last week as the market has continued to grind out support and fail to break above overhanging resistance.

2019-1-26 03:13


Ether Price Analysis: Historic Support Tested Amid Signs of Distribution

It’s been weeks since ether has seen a new high or a new low and the market has found itself range-bound. At the moment, we are seeing signs of distribution as large rounds of selling have remained present during key support tests:Figure 1: ETHUSD, 4 Hour Candles, Trading RangeSo far, for the last few weeks, ether has seen a trend of higher lows and low highs (the converging red trendlines).

2018-10-20 01:31


Фото:

Bitcoin Price Analysis: High Shorts Count Could Signal Price Hike

Once again, bitcoin finds itself precariously perched on the bottom of its macro trading range (TR). After a strong round of selling over the course of two weeks plunged the price back to the $6,000s, bitcoin began consolidating for several weeks at the bottom of the TR:Figure 1: BTC-USD, 1-Day Candles, Macro TRAs shown in the figure above, the market has interacted several times at the current price range and it has been a source of three major bullish rallies.

2018-8-25 00:42