2021-7-30 23:03 |
One of the biggest factors influencing the recent Bitcoin bull run hands down has been the digital gold narrative and the capital flows from precious metals into crypto.
However, looking back at the XAUBTC chart over the last several months, the recent retracement across crypto makes it look like the bull run never even started, and could highlight how Bitcoin has really only begun its big breakout.
How Bitcoin Beats Gold At Its Own StandardsEarly writings of Satoshi Nakamoto reveal the mysterious person or group’s intention to produce an element like gold that could be sent across communication channels. They ultimately achieved this with Bitcoin, an asset that is more scarce than the long-time gold standard is itself.
The first ever cryptocurrency also has a mechanism built into its protocol that slashes the new supply in half every four years or so. This tends to occur when demand begins to rise, further creating an environment for parabolic price action.
Related Reading | Apple Co-Founder Says Bitcoin Is A “Miracle,” It’s Better Than Gold
With gold, miners produce more and more when demand is highs, which brings prices back down to equilibrium. And this is only scratching the surface of what the soft metal fails to beat Bitcoin at.
There’s no chance of counterfeiting, no cost to store, and no physical footprint. Moving it is significantly less complicated or costly, for example. Yet the most bullish thing the top cryptocurrency has going for it, is its price chart.
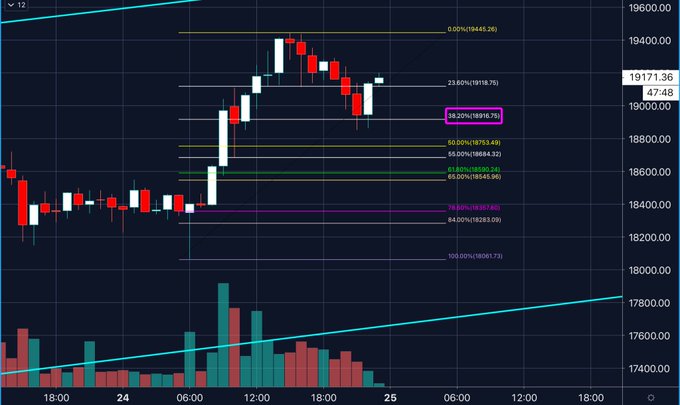
The bull run doesn't even look to have started yet | Source: XAUBTC on TradingView.com XAUBTC Chart Suggests Crypto Cycle Has Barely BegunThe Bitcoin price chart is bullish enough when put up against the dollar, however, things are even better looking when you put BTC up against gold. The XAUBTC chart pair looks similar to an inverted USD chart, but there’s a critical difference: a retest of the former all time high.
With a retest of resistance turned support out of the way which has now held, a run to the next equidistance level could be ahead. This also makes it look like the bull run in Bitcoin has barely even begun.
Related Reading | Falling Lumber Prices, Inflation, And The Impact On Bitcoin As Digital Gold
An evening star pattern resembles the 2013 pause before the final push to the then all-time high – the record high that kicked off the longest bear market on record.
Price action also continues to follow an inverse parabolic curve, with price action aimed downward suggesting that the two assets will diverge even further in the future. It also could indicate that Bitcoin is ready to rip once again, as there’s no real place but to go but up against gold after failing to get through support. With gold also starting to turn bullish, the crypto cycle will have to heat up like never before to keep up such pace.
Follow @TonySpilotroBTC on Twitter or via the TonyTradesBTC Telegram. Content is educational and should not be considered investment advice.
Featured image from iStockPhoto, Charts from TradingView.com origin »Bitcoin price in Telegram @btc_price_every_hour
Emerald Crypto (EMD) на Currencies.ru
|
|