Ethereum Price Analysis ETH / USD: False Hope

2019-8-12 16:35

Ethereum has a bearish short-term bias, with the ETH / USD pair still trading below its 200-period moving average on the four-hour time frame The four-hour time frame shows that price has moved back inside a triangle pattern after a false bullish breakout The daily time frame shows that the ETH / USD pair is trading below the neckline of a head and shoulders pattern Ethereum / USD Short-term price analysis

Ethereum has a bearish short-term trading bias, with the cryptocurrency still trading below its 200-period moving average on the four-hour time frame.

The four-hour time frame shows that the ETH / USD pair has moved back inside a neutral triangle pattern, following a false upside breakout towards the $240.00 level.

Technical indicators on the four-hour time frame currently have a slight bullish bias.


ETH / USD H4 Chart by TradingView


Pattern Watch

Traders should note that a bearish breakout from the triangle pattern could prompt a decline towards the $170.00 level.

Relative Strength Index

The RSI indicator on the four-hour time frame has a bullish bias and is currently attempting to stabilize above neutral territory.

MACD Indicator

The MACD indicator on the four-hour time frame is rising and is starting to issue a buy signal.

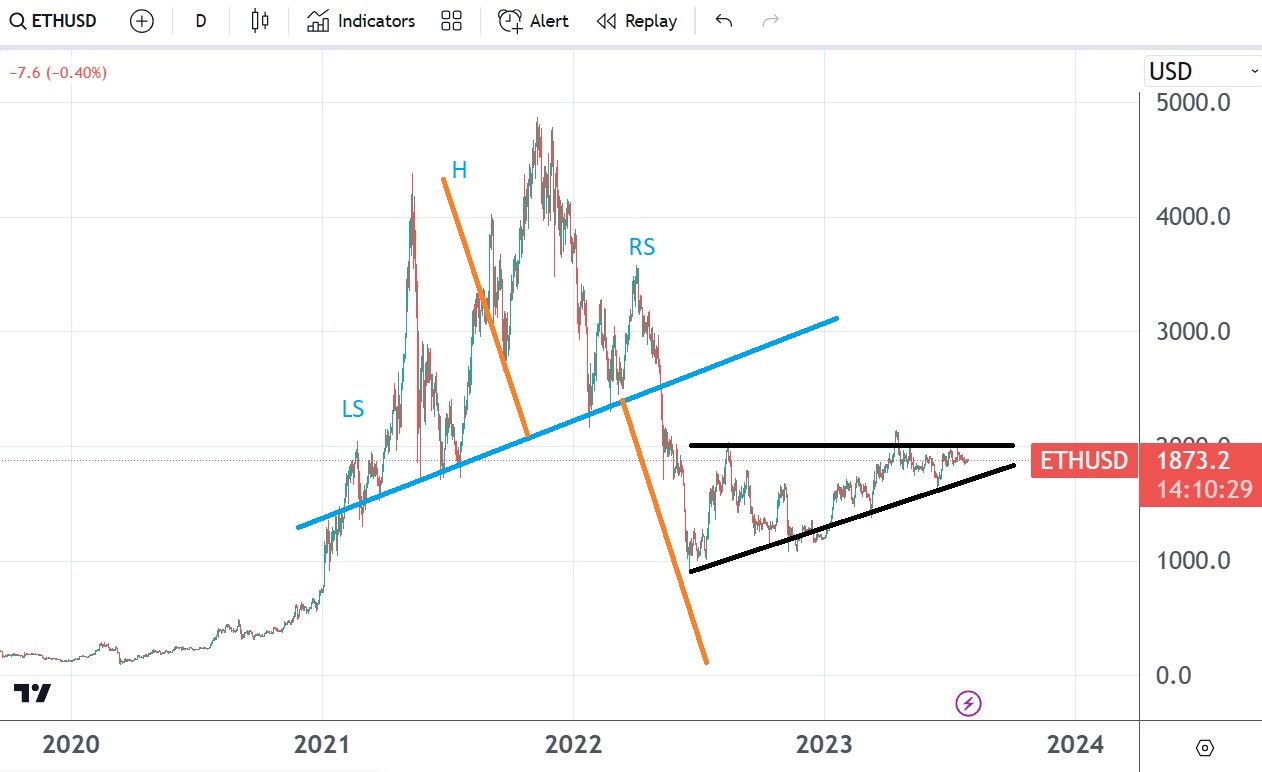
Ethereum / USD Medium-term price analysis

Ethereum has a neutral medium-term trading bias, with the ETH / USD pair consolidating around its trend defining 200-day moving average.

The daily time frame is showing that the ETH / USD pair is trading below the neckline of a bearish head and shoulders pattern, following a failed attempt to break higher.

Key technical resistance on the daily time frame is located at the $240.00 $275.00 levels, while key downside support is found at the $200.00 and $170.00 levels.

Technical indicators on the daily time frame currently have a slight bearish bias.


ETH / USD Daily Chart by TradingView


Pattern Watch

Traders should be on guard for a strong upside rally towards the $275.00 level to complete the bearish head and shoulders pattern.

Relative Strength Index

The RSI indicator on the daily time frame is bearish and continues to issue a sell signal.

MACD Indicator

The MACD indicator on the daily time frame is turning lower and currently has a slight negative bias.

Conclusion

Ethereum is coming under increasing downside pressure and risks falling below the $200.00 level, following the recent rejection its 200-period moving average on the four-hour time frame.

Overall, bulls quickly need to rally the ETH / USD pair away from the $200.00 level in order to avoid triggering a bearish head and shoulders pattern.


Check out our introductory guide to Ethereum.


Ethereum ChartChart byCryptoCompare baseUrl = "https://widgets.cryptocompare.com/"; var scripts = document.getElementsByTagName("script"); var embedder = scripts[ scripts.length - 1 ]; var cccTheme = { "General":{"borderWidth":"0px","borderColor":"#FFF","showExport":true}, "Tabs":{"borderColor":"#FFF","activeBorderColor":"rgba(28,113,255,0.85)"}, "Chart":{"fillColor":"#222","borderColor":"rgba(28,113,255,0.85)"}, "Conversion":{"lineHeight":"10px"}}; (function (){ var appName = encodeURIComponent(window.location.hostname); if(appName==""){appName="local";} var s = document.createElement("script"); s.type = "text/javascript"; s.async = true; var theUrl = baseUrl+'serve/v3/coin/chart?fsym=ETH&tsyms=USD,EUR,CNY,GBP'; s.src = theUrl + ( theUrl.indexOf("?") >= 0 ? "&" : "?") + "app=" + appName; embedder.parentNode.appendChild(s); })(); #ccpw-ticker-24553 .ccc-chart-header { background: #1c71ff} #ccpw-ticker-24553 #ccc-chart-block .exportBtnTop, #ccpw-ticker-24553 a.tabperiods.tabperiods_active, #ccpw-ticker-24553 .coin_details { color: #1c71ff; background: rgba(28,113,255,0.15); } #ccpw-ticker-24553 .coin_details { border: 1px solid rgba(28,113,255,0.16); } .ccpw-container_chart #ccpw-ticker-24553 .coin-container:after, .ccpw-container_four #ccpw-ticker-24553 .coin-container:after {border-color:#ccc !Important;}


The post Ethereum Price Analysis ETH / USD: False Hope appeared first on Crypto Briefing.

Similar to Notcoin - TapSwap on Solana Airdrops In 2024

origin »

Ethereum (ETH) на Currencies.ru

$ 3110.36 (+0.03%)
Объем 24H $8.232b
Изменеия 24h: -0.53 %, 7d: 6.70 %
Cегодня L: $3101.28 - H: $3134.76
Капитализация $373.63b Rank 2
Цена в час новости $ 211.86 (1368.12%)

usd eth time ethereum frame false price

usd eth → Результатов: 126


Технический анализ Ethereum: ETH/USD стремится к $250

На этой неделе техническая картина Ethereum переключилась со слабости прошлой недели на демонстрацию силы. Сессия выходного дня показала, что ETH/USD не только держится выше поддержки на $232, но и приближается к краткосрочному сопротивлению на $240.

2020-7-20 11:51


Ethereum Price Analysis ETH / USD: Extensive Losses

Ethereum has a bearish short-term bias, with the ETH / USD pair crashing below key technical support on the four-hour time frame The four-hour time frame shows that the recent bearish triangle breakout has accelerated the ETH / USD pair’s decline The daily time frame shows that the bearish head and shoulders pattern is close […] The post Ethereum Price Analysis ETH / USD: Extensive Losses appeared first on Crypto Briefing.

2019-8-15 16:16


Ethereum Price Analysis ETH / USD: Landing With A Parachute

Ethereum has a neutral short-term trading bias, with the ETH / USD pair approaching its 200-period moving average on the four-hour time frame The four-hour time frame is currently showing a valid head and shoulders pattern The ETH / USD pair has now moved below key neckline support on the daily time frame Ethereum / […] The post Ethereum Price Analysis ETH / USD: Landing With A Parachute appeared first on Crypto Briefing.

2019-6-6 16:28


Анализ цен BTC, ETH, XRP (05.06.19)

BTC/USD Вчера, после снижения в область 7800. 00 USD, медведи взяли непродолжительную паузу и цена BTC смогла восстановиться к восьми тысячам. Однако вечером давление медведей возобновилось и снижение продолжилось к поддержке 7400.

2019-6-5 10:23


Анализ цен BTC, ETH, XRP (04.06.19)

BTC/USD Вчера утром, поддержка 8700. 00 USD не смогла остановить снижение цены, вызванное нарастающим объёмом продаж. В результате за три часа, цена Bitcoin откатилась ниже уровня 8500. 00 USD. На этом рубеже покупатели приняли вызов и до завершения дня борьба шла с переменным успехом.

2019-6-4 10:22


Анализ цен BTC, ETH, XRP (03.06.19)

BTC/USD В воскресенье торги проходили спокойно. Цена BTC продолжила консолидацию в узком диапазоне и как-то незаметно перебралась от поддержки 8500. 00 USD к 8700. 00 USD.   Кажется, что крупные игроки ещё не определились куда выгоднее сдвинуть рынок.

2019-6-3 09:51


Прогноз эфира на июнь 2019 года

Привет на новостях криптовалют, с вами Виктор Томилин (статья обновляется в течение месяца). В статье аналитика и прогнозы от профессиональных трейдеров сервиса tradingview на июнь 2019 года в паре Ethereum, эфереум/доллар – ETH/USD (теханализ простыми словами).

2019-6-2 10:47


Анализ цен BTC, ETH, XRP (30.05.19)

BTC/USD Вчера утром цена BTC пробила уровень часовой скользящей средней EMA55 и протестировала поддержку 8500. 00 USD. В отсутствии сильного медвежьего давления удалось избежать глубокого снижения. Во второй половине дня, пара BTC/USD смогла восстановиться к уровню средних цен EMA55 и в районе отметки 8640.

2019-5-30 08:25


Анализ цен BTC, ETH, XRP (29.05.19)

BTC/USD Вчера мы наблюдали за тем, как цена BTC поведёт себя в районе отметки 8700. 00 USD, где проходит контрольная линия паттерна Алмаз.  Первый прорыв оказался ложным и установил минимум в районе поддержки 8500.

2019-5-29 10:24


Анализ цен BTC, ETH, XRP (28.05.19)

BTC/USD После обновления годового максимума до уровня 8940. 00 USD, цена BTC немного откатилась и на часовом графике сформировала фигуру технического анализа «Алмаз».  Эта классическая фигура разворота бычьего тренда в медвежий.

2019-5-28 10:09


Анализ цен BTC, ETH, XRP (24.05.19)

Консолидация рынка на снижающихся объёмах может постепенно перейти в продолжение коррекции к целевым уровням медведей. BTC/USD Вчера, в полдень, цена BTC установила локальный минимум на отметке 7468.

2019-5-24 09:49


Анализ цен BTC, ETH, XRP (23.05.19)

Если сегодня окажется, что медвежий прорыв ложный, то шанс на продолжение бычьего забега сохраняется. BTC/USD Вчера покупатели не смогли поддержать рынок объёмами. Более того, в завершении дня цена BTC выпала из сужающегося коридора консолидации и от ре-теста уровня 7400.

2019-5-23 08:34