2019-1-5 08:41 |
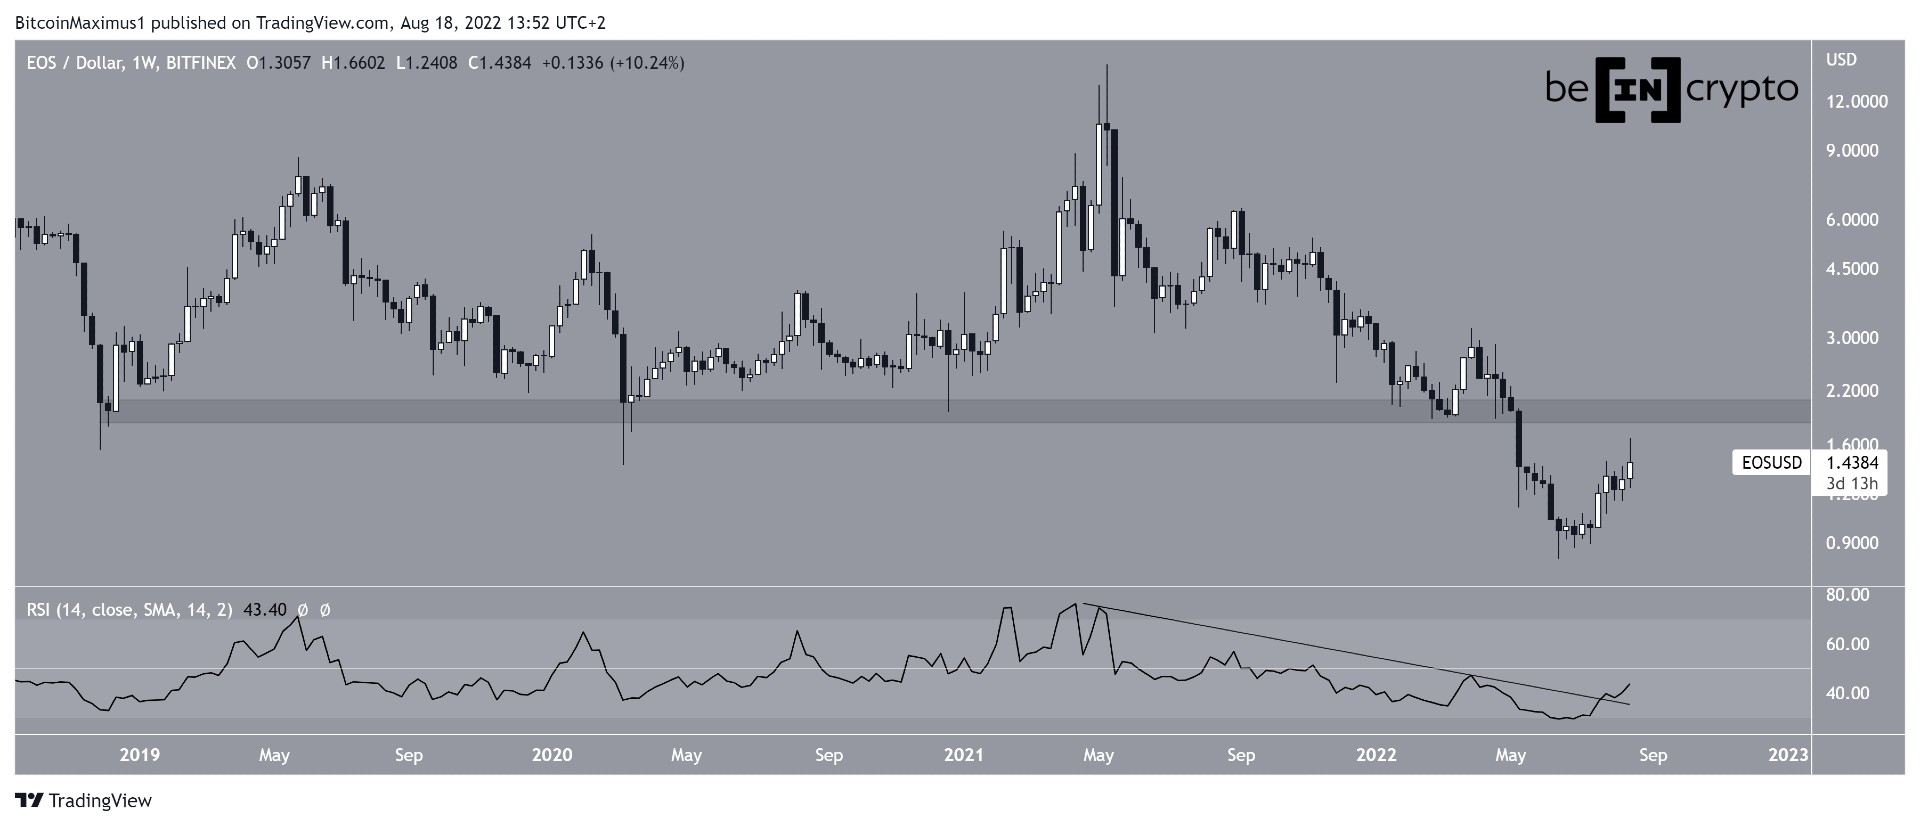
EOS/USD Long-term Trend: Bearish Resistance levels: $ 6, $7, $8. Support levels: $3, $2, $1.
The EOS/USD pair was in a sideways trend in the last two weeks. On December 23, the bulls reached the high of $3.09 but face resistance at the $3.0 price level. The crypto fell to the low of $2.58 and commenced a range bound movement above that price level. On the daily chart, the 12-day EMA and the 26-day EMA were trending horizontally indicating that price was in a sideways trend.
However, from the weekly chart, the crypto’s price is in the bearish trend zone. The crypto’s price is making a bullish movement to the EMAs. Meanwhile, the price of EOS is below the 12-day EMA and the 26-day EMA which indicates that price is likely to fall.
The MACD line and the signal line are below the zero line which indicates a sell signal. Also, the stochastic indicator is in the oversold region but above the 20% range indicating that the price of EOS is in a bullish momentum and a buy signal.
The views and opinions expressed here do not reflect that of BitcoinExchangeGuide.com and do not constitute financial advice. Always do your own research.
origin »Bitcoin price in Telegram @btc_price_every_hour
EOS (EOS) на Currencies.ru
|
|