2025-10-16 01:30 |
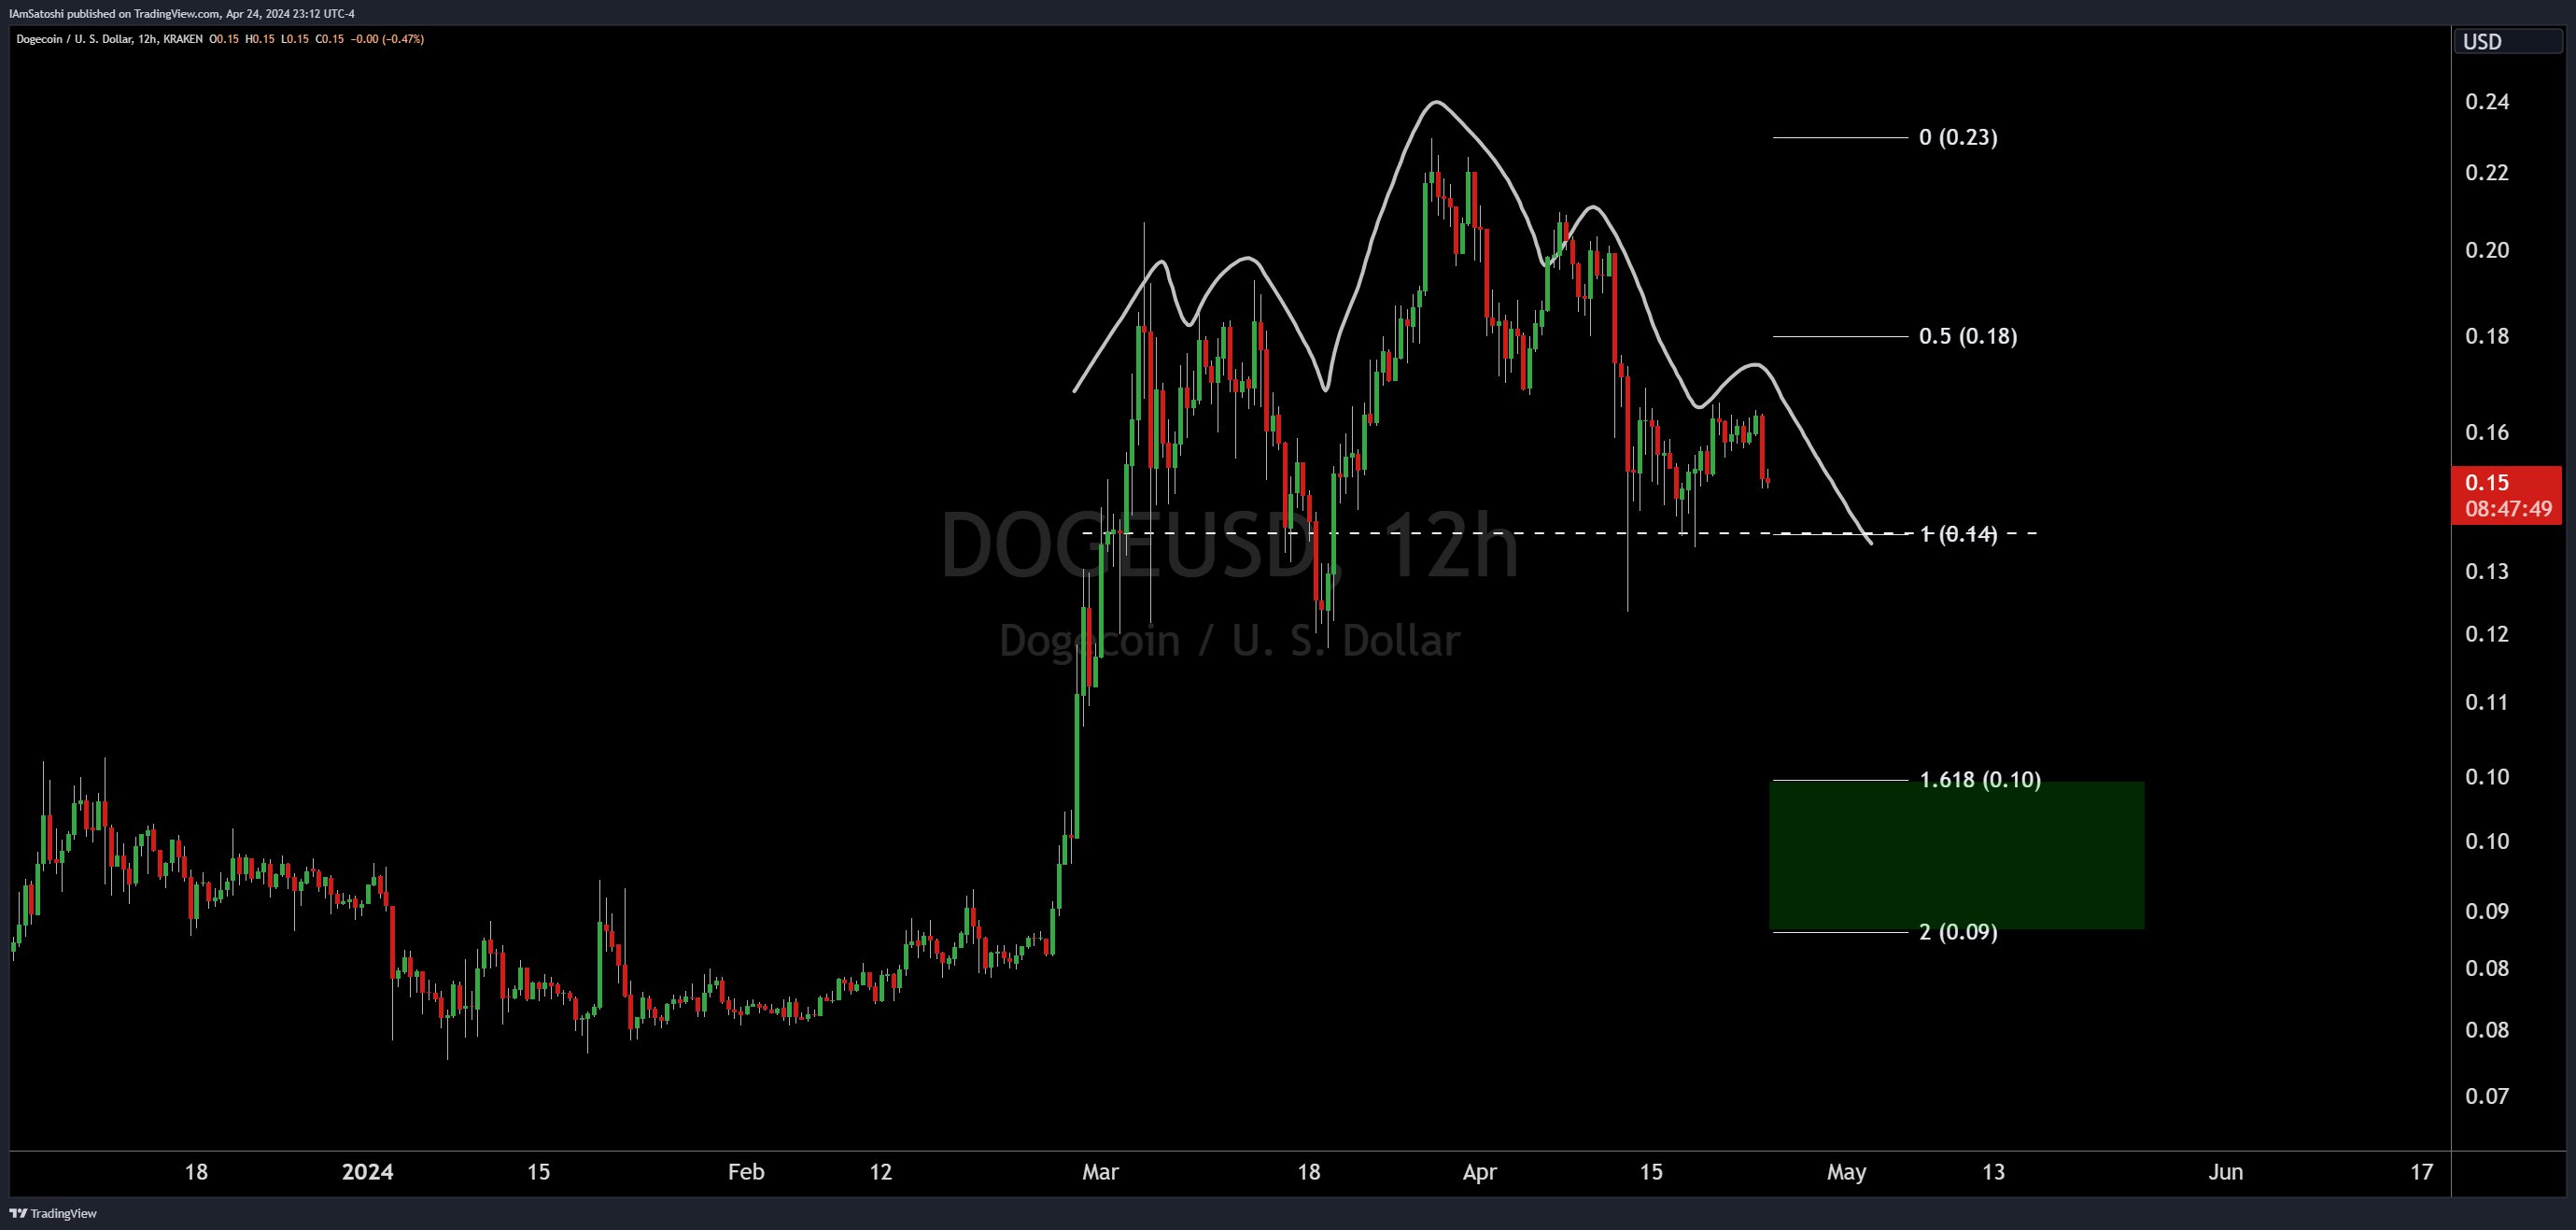
Dogecoin price might be getting ready for a big move, and according to analyst Ali, the chart is flashing something major. He pointed out a massive price gap between $0.07 and $0.19 on Dogecoin’s UTXO Realized Price Distribution (URPD) chart from Glassnode.
In plain English, that means there’s a big section of the chart where not much trading activity has ever happened. And when you see that kind of gap, it usually means volatility is coming.
What’s Going On With Dogecoin PriceRight now, Dogecoin is hanging around $0.13, trying to recover from the recent market chaos. What Ali’s chart shows is that most DOGE holders either bought much lower, near $0.07, or way higher, closer to $0.19.
Between those two prices, there just isn’t much on-chain activity, no big buying or selling zones to act as support or resistance.
That’s what makes this gap so interesting. If DOGE price starts gaining momentum again, it could shoot straight through that range really fast because there’s not much in its way. But the same goes the other direction, if sentiment turns bearish, it could drop back down just as easily.
What the DOGE Chart Is ShowingThe URPD chart basically maps out where most coins last moved on the blockchain. Think of it like a heat map showing the strongest price levels.
In this case, the thick cluster around $0.07 tells us a lot of people bought there; that’s solid support. Above that, though, there’s almost nothing until $0.19, which creates what Ali called the “GAP.”
That gap is important because it often acts like a magnet for price action. Markets don’t like leaving these empty zones untested for too long. Whether DOGE price moves up or down, it’ll likely revisit this range eventually, to “fill” that space with trading volume.
Read Also: Expert Says Plasma (XPL) Could Be the Next TRON – Here’s When the Real Rally Might Start
Image Source: X/AliHowever, Ali summed it up perfectly: “Gaps don’t stay open forever.” In technical analysis, when you spot a void like this, it usually gets filled sooner or later. So what does that mean for Dogecoin?
If buyers step in and push the price above $0.19, we could see a fast rally, maybe even up to $0.25–$0.30, as traders rush to ride the move. On the flip side, if the market cools off again, DOGE price could easily slide back toward that $0.07–$0.09 zone before finding solid support again.
Dogecoin Price Short-Term OutlookDogecoin’s next move will depend on market sentiment and volume. When hype kicks back in, DOGE price tends to move fast, and that empty price range could be the perfect setup for a quick breakout.
So whether you’re bullish or bearish, keep an eye on that $0.07–$0.19 gap. It’s not just space, it’s a roadmap for Dogecoin’s next big swing.
Subscribe to our YouTube channel for daily crypto updates, market insights, and expert analysis.
The post Dogecoin (DOGE) Chart Reveals a Dangerous Gap, And It Might Be About to Fill Fast appeared first on CaptainAltcoin.
origin »Bitcoin price in Telegram @btc_price_every_hour
ETH/LINK Price Action Candlestick Set (LINKETHPA) на Currencies.ru
|
|