2026-1-7 17:14 |
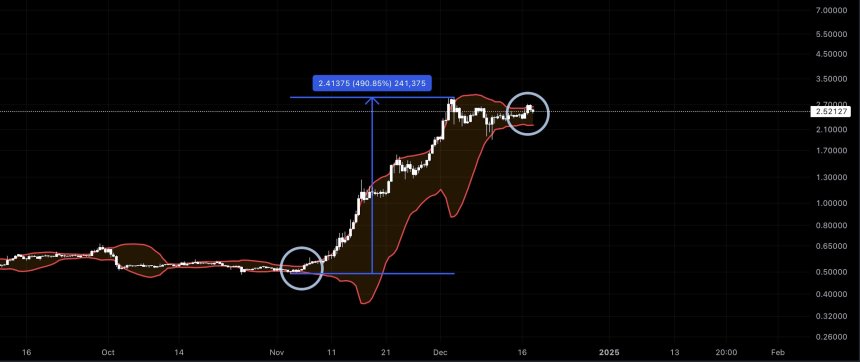
Do not get too comfortable above $2 — XRP just hit a classic Bollinger rejection zone, and both daily and weekly charts now point to a likely dip back into sub-$2 territory before any real price breakout. origin »
Bitcoin price in Telegram @btc_price_every_hour
Ripple (XRP) на Currencies.ru
$ 1.4393 (-0.35% )
Объем 24H $1.373b
Изменеия 24h: -0.10 % , 7d: 3.24 %
Cегодня L: $1.4353 - H: $1.4502
Капитализация $88.294b Rank 4
Цена в час новости $ 2.2065 (-34.77% )
|
|