2023-11-30 18:00 |
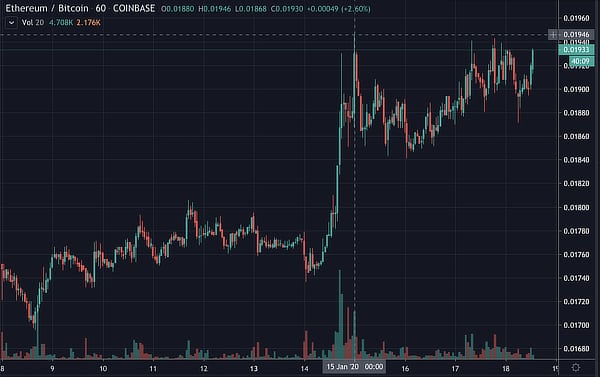
The Ethereum (ETH) to Bitcoin (BTC) ratio (ETH/BTC) is a pivotal metric, offering insights into the relative strength and market dominance of the two largest cryptocurrencies. Representing the value of one Ethereum in terms of Bitcoin, the ratio serves as a critical tool for investors and analysts to gauge the comparative performance and sentiment towards these digital assets.
Historically, the ratio has experienced significant fluctuations. It reached its all-time high in June 2017, when Ethereum’s value significantly overshadowed Bitcoin’s. Conversely, Dec. 2016 saw the ratio reach its all-time low, reflecting a time when Ethereum’s value dropped significantly compared to Bitcoin.
The graph shows the ETH/BTC ratio from May. 1, 2016, to Nov. 28, 2023 (Source: TradingView)However, the overall volatility of this ratio, measured by the standard deviation of its historical closing prices, is relatively moderate. This is indicative of the often parallel price movements of BTC and ETH, as they typically mirror each other’s market trends.
The synchronized movement of BTC and ETH is a defining factor in the observed stability of the ETH/BTC ratio. When both cryptocurrencies experience similar bullish or bearish trends, their ratio maintains equilibrium, underscoring the interdependence in their market movements. This phenomenon is a testament to the correlated nature of the crypto market, where major currencies often share similar market sentiments and external influences.
From Jan. 2020 to Oct. 2022, the ETH/BTC ratio saw an uptrend, attributed mainly to the anticipation surrounding the Merge — Ethereum’s transition to a Proof-of-Stake consensus mechanism. This significant upgrade in Ethereum’s blockchain was viewed as a pivotal step towards enhancing its efficiency and scalability, potentially increasing its value relative to Bitcoin.
However, after Oct. 2022, the ratio exhibited a downward trend. This decline could be a market correction following the high expectations the Merge set or a reflection of broader market trends affecting both cryptocurrencies. It also shows that, during this period, Ethereum’s growth or decline in value was not as pronounced as Bitcoin’s, leading to a decrease in its relative value.
Graph showing the ETH/BTC ratio from October 2022 to November 2023 (Source: TradingView)The ETH/BTC ratio offers significant insights into the market’s current dynamics. The relatively low ratio can be primarily attributed to Bitcoin’s more substantial price increase than Ethereum. YTD, Bitcoin has seen a 126% increase, while Ethereum’s growth, although notable, was relatively lower at 69%. This disparity in their growth rates has been a critical factor in keeping the ETH/BTC ratio subdued.
Graph showing the YTD percent return for Bitcoin (BTC) and Ethereum (ETH) (Source: TradingView)The differing trajectories in their prices show Bitcoin’s increasing dominance in the market. While Ethereum continues to play a significant role in the crypto ecosystem, especially as the home of DeFi, Bitcoin’s more significant price increase underscores its growing prominence and possibly greater investor confidence. This trend is reflected in the ETH/BTC ratio, serving as a barometer for Bitcoin’s strengthening position relative to Ethereum.
The ratio’s movement clearly indicates the shifting balance of power within the crypto market, with Bitcoin currently taking a more dominant role.
The post Decline in ETH/BTC ratio shows Bitcoin’s rising market dominance appeared first on CryptoSlate.
origin »Bitcoin price in Telegram @btc_price_every_hour
Bitcoin (BTC) на Currencies.ru
|
|