2023-7-30 12:24 |
July was a bearish month for the cryptocurrency market. This was especially noticeable in the case of Bitcoin (BTC), which fell sharply after reaching a new yearly high on July 13.
August has the potential to be a very important month for the altcoin market. The Bitcoin dominance rate (BTCD) has stagnated and could be in the initial stages of a downward movement. BeInCrypto looks at the top cryptos for August that could hit new all-time highs.
OKB (OKB) Price Wave Count Can Lead to New All-Time HighSince June 2022, the price of OKB has experienced a rapid increase which resembles a five-wave upward movement. If so, it is currently in wave four of this Elliott Wave count. Technical analysts use the Elliott Wave theory to identify recurring long-term price patterns and investor psychology, aiding them in determining the trend’s direction.
Read More: 6 Best Copy Trading Platforms in 2023
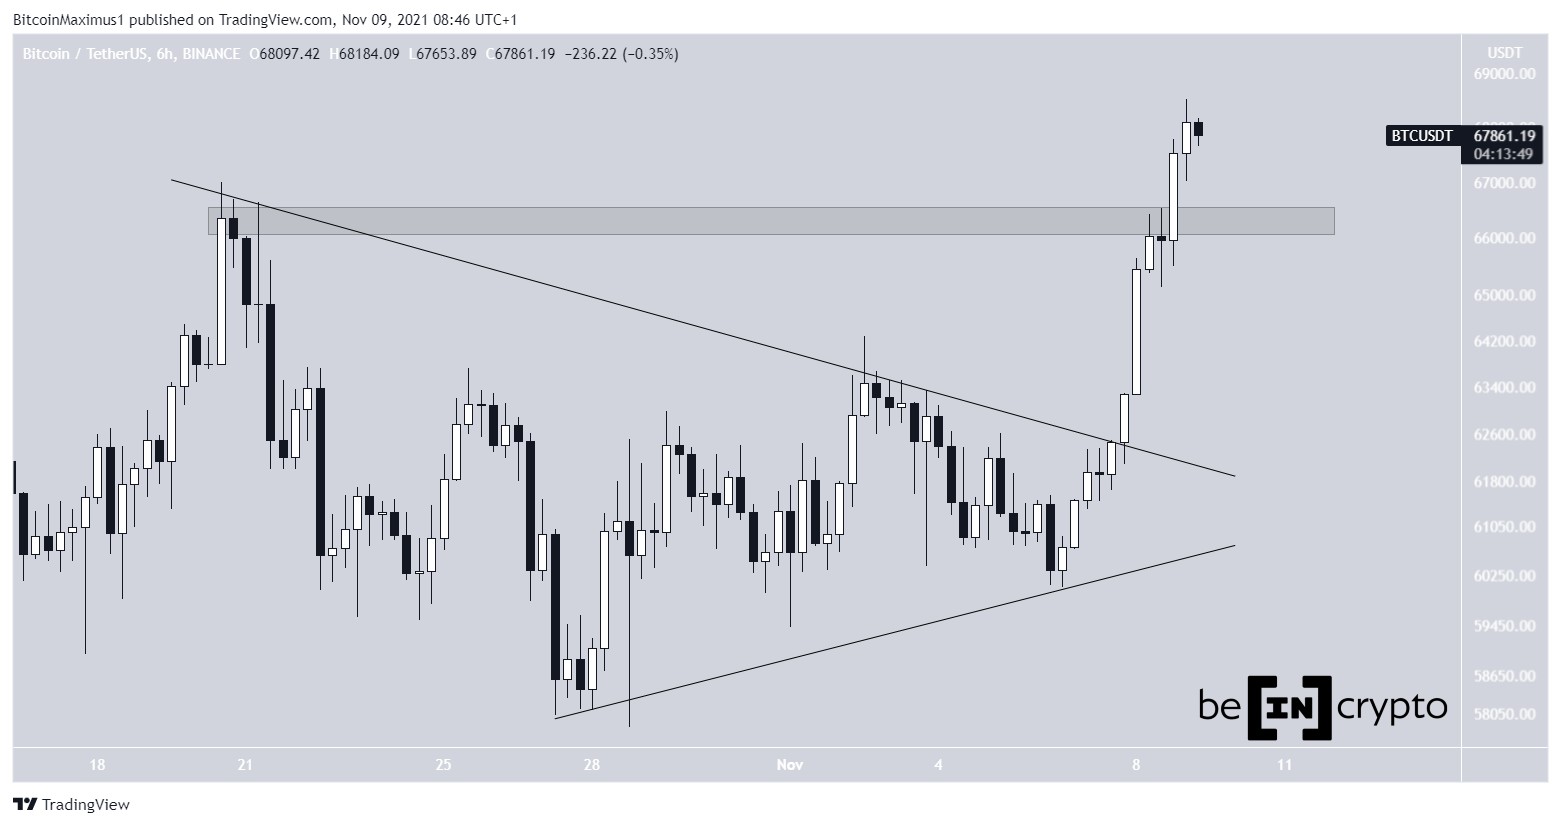
The presence of a symmetrical triangle in what could be wave four along with the shape of wave three support this wave count. If this interpretation is correct, OKB’s price is expected to break out from the triangle and surge towards the next resistance level at $72.10, setting a new all-time high price.
The target is found using the 1.61 Fib extension on wave four. This Fib method is often used when the price is close to an all-time high, meaning that there is no horizontal resistance left above the price.
OKB/USDT Daily Chart. Source: TradingViewHowever, it’s essential to consider that if the price breaks down from the triangle pattern, this bullish prediction for OKB’s price becomes invalid, and it could potentially lead to a decline towards $34.3.
Read More: Best Crypto Sign-Up Bonuses in 2023
Maker (MKR) Price Moves Above $1,000The MKR price had two significant bullish developments in July: It broke out from a 790-day descending resistance line, and it cleared the $1,000 horizontal resistance area. Since these were important diagonal and horizontal resistance levels, the breakout above them is a strong sign that the trend is bullish.
The next crucial resistance for the price is at $2,100. This amounts to an increase of 70% measuring from the current price. While the all-time high is 410% above the price, making its breach a difficult task, the $2,100 area is more attainable.
MKR/USDT Daily Chart. Source: TradingViewDespite this bullish MKR price prediction, a close below $1,000 will invalidate this positive forecast. If that occurs, the bullish structure will be invalid and MKR will likely fall to the next closest support at $750.
Transform your crypto game with predictive insights. Visit now:
Maker (MKR) Price Prediction 2023/2025/2030
TomoChain’s (TOMO) Next Wave Could Lead to a New All-Time HighThe TOMO price also shows decisive bullish signs. The main reason for this is the 450% upward movement since the start of the year.
During this increase, the TOMO price reclaimed the $95 resistance area. This is a crucial level since it is the final horizontal resistance before the all-time high at $3.90.
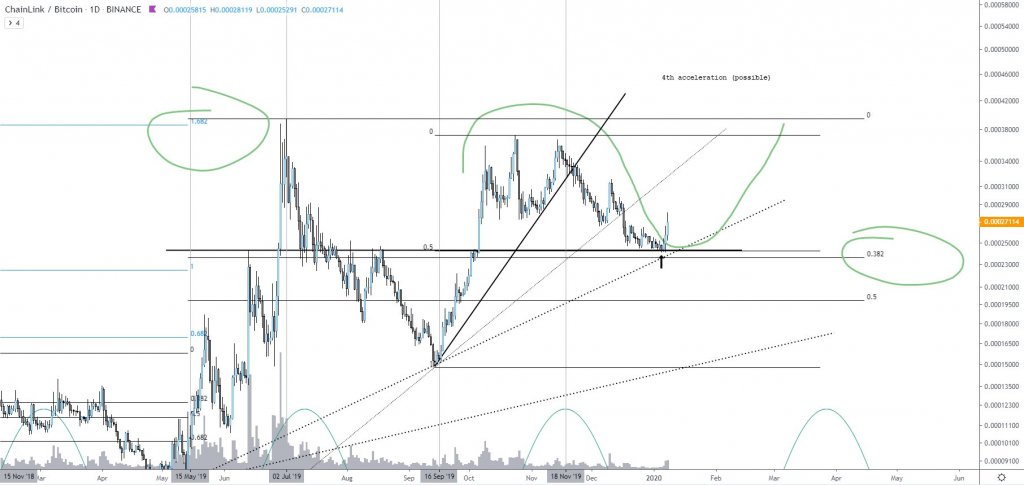
Additionally, the wave count suggests that the price will reach a new all-time high. According to the count, the price is in the fifth and final wave of the increase that began at the start of the year.
To determine the direction of a trend, technical analysts use the Elliott Wave theory, which involves studying recurring long-term price patterns and investor psychology.
If the count is correct, the ongoing bounce at the $0.95 area (green icon) marks the end of wave four and the beginning of wave five.
An upward movement to the all-time high region will be an increase of 160% measuring from the current price.
TOMO/USDT Daily Chart. Source: TradingViewDespite this bullish TOMO price prediction, a fall and close below the $0.95 area will mean that the trend is bearish. If that were to occur, the retracement could continue to the $0.70 support level.
Will Ocean Protocol (OCEAN) Break out From Long-Term Resistance?The OCEAN price has fallen under a descending resistance line since its all-time high of $1.94 in April 2023. More specifically, the line has been in place for 829 days. So far, the price has made six unsuccessful breakout attempts (red icons).
Since lines get weaker each time they are touched, an eventual breakout from the line is likely.
Additionally, the price has traded inside a descending parallel channel since the beginning of February. These channels usually contain corrective patterns. Therefore, an eventual breakout from it is the most likely future price scenario.
This aligns with the numerous attempts at breaking out weakening the long-term resistance.
OCEAN/USDT 3-Day Chart. Source: TradingViewHowever, since the all-time high is more than 460% away from the current price, it will be difficult to reach. A more reasonable target in case of a long-term breakout would be the $1 resistance area, which is 190% away from the current price.
Read More: 9 Best AI Crypto Trading Bots to Maximize Your Profits
For BeInCrypto’s latest crypto market analysis, click here
The post 4 Cryptos That Could Hit New All-Time Highs in August appeared first on BeInCrypto.
origin »Bitcoin price in Telegram @btc_price_every_hour
Time New Bank (TNB) на Currencies.ru
|
|