2020-5-5 21:15 |
The Bitcoin (BTC) price increased considerably during the week of April 27-May 4, creating a weekly bullish engulfing candlestick. However, the price failed to confirm a breakout above a key resistance level.
The bullish candlestick was the seventh successive green candlestick for BTC. This has not occurred since April 2019, when the last bear market ended. However, even then, the eighth candlestick was bearish, before the price resumed its upward movement.
In this article, we will take a look at the Bitcoin price movement along with nine other cryptocurrencies.
Bitcoin (BTC)The Bitcoin price has been decreasing since April 30, when it reached a high of $9,460. The decrease has taken the form of a descending triangle, which is known as a bearish reversal pattern. Therefore, even though the pattern is transpiring after an upward move, it is possible that it will lead to a breakdown.
At the time of writing, the BTC price was trading very close to the support line of the channel, having begun an upward move towards resistance. This move is expected to continue, since the RSI has also bounced at the 50 line.
However, the price is likely to eventually break down from the triangle and reach the closest support level at $7,700, which also coincides with the long-term ascending support line. A breakout above the resistance line of the triangle would invalidate this possibility.
Bitcoin Chart By Trading View Ethereum (ETH)The Ethereum price has been increasing since March 13, when it reached a bottom. The price has been moving at an accelerated pace, creating a parabolic ascending support line. However, after ETH reached a high of $227.5 on April 30, it began a downward move that caused it to break down from this support line several days later.
The price outlook is bearish. Besides the breakdown, Ethereum has failed to move above the main resistance area at $217.5, which is also the 0.786 Fib level of the entire downward move. Combining this with the fact that the price has broken down from the support line, a further decrease seems imminent.
The closest support level is found at $170, possibly supported by the 25-day moving average (MA).
Ethereum Chart By Trading View XRP (XRP)The XRP price has been following an ascending support line since April 16. The increase continued until April 30, when the XRP price reached a high of $0.236. The price has been decreasing since, completing an A-B-C correction that has taken it all the way to the ascending support line. In addition, XRP is possibly following a descending resistance line (dashed).
The RSI is bearish since it has dropped below 50 and has not generated any bullish divergence, which would be a sign of a reversal. While the ascending support line is likely to cause a bounce, taking the price all the way to the descending resistance line, we cannot state with certainty that the price will break out, due to the lack of bullish signs.
XRP Chart By Trading View Bitcoin Cash (BCH)The Bitcoin Cash price has been trading inside a symmetrical triangle since March 9. The resistance line of the triangle is only slightly below the main resistance area, which is found at $275.
The price has reached this resistance level thrice, always in the form of a long upper wick that has been sold up quickly. At the time of writing, the price had been rejected by this resistance line and moving towards support.
The RSI is bearish, since it shows hidden bearish divergence in the most recent highs. In addition, the symmetrical triangle is transpiring after a downward move, and in such cases it is likely to act as a continuation pattern and cause a breakdown. If it acts in this manner, the closest support area is found at $180.
BCH Chart By Trading View Bitcoin SV (BSV)The Bitcoin SV price is currently moving towards the ascending support line of the channel it has been trading in since April 5. At the time of writing, the price had broken down below the midpoint (EQ) of the channel and was moving towards the support line.
The support line is found at $185 and is very likely to initiate a bounce. The main reasons for this are the support offered by the 50-day MA, and the RSI, which is approaching the 50-line from above, a very suitable level from which it can bounce.
A bounce would take the price towards the middle of the channel and possibly the resistance line, while a breakdown could trigger a rapid drop towards $150.
BSV Chart By Trading View Litecoin (LTC)The Litecoin price is trading inside an ascending channel and has been doing so since March 17. The price reached the resistance line of the channel on April 30. The price has been decreasing since, moving below the EQ of the channel.
The closest resistance area is found between $48-80, coinciding with the resistance line of the channel. The price has created a double top inside it, combined with bearish divergence in the RSI, which suggests the price will decrease. This pattern preceded the drop below the EQ.
The price is expected to drop to the support line of the channel once more. If it breaks down, the closest support area is found at $38.
LTC Chart By Trading View Binance Coin (BNB)On April 30, the Binance Coin (BNB) price reached a high of $19.15. It has been gradually decreasing since, currently being slightly below the ascending support line that the price had been following since March 13. In addition, the price has lost the support of the 100-day moving average (MA).
If the price breaks down from this support line, which is looking likely, the closest support level is found at $14. On the other hand, BNB is still trading inside a strong support level, found at $16.5. If it manages to stay above it, it is likely to make another attempt at moving towards $20.
BNB Chart By Trading View EOS (EOS)The EOS price has been increasing at a rate predicted by its ascending support line since March 13.
On April 30, the price reached a high of $3.11, right at the resistance offered by the 200-day MA and the $3.1 resistance area. The price has been decreasing since, reaching the ascending support line one more time. This is a very likely spot to initiate a bounce, also since the daily RSI has reached the 50-line from above, a likely level for a reversal.
Therefore, the price is expected to make another attempt at moving inside the resistance area at $3.11.
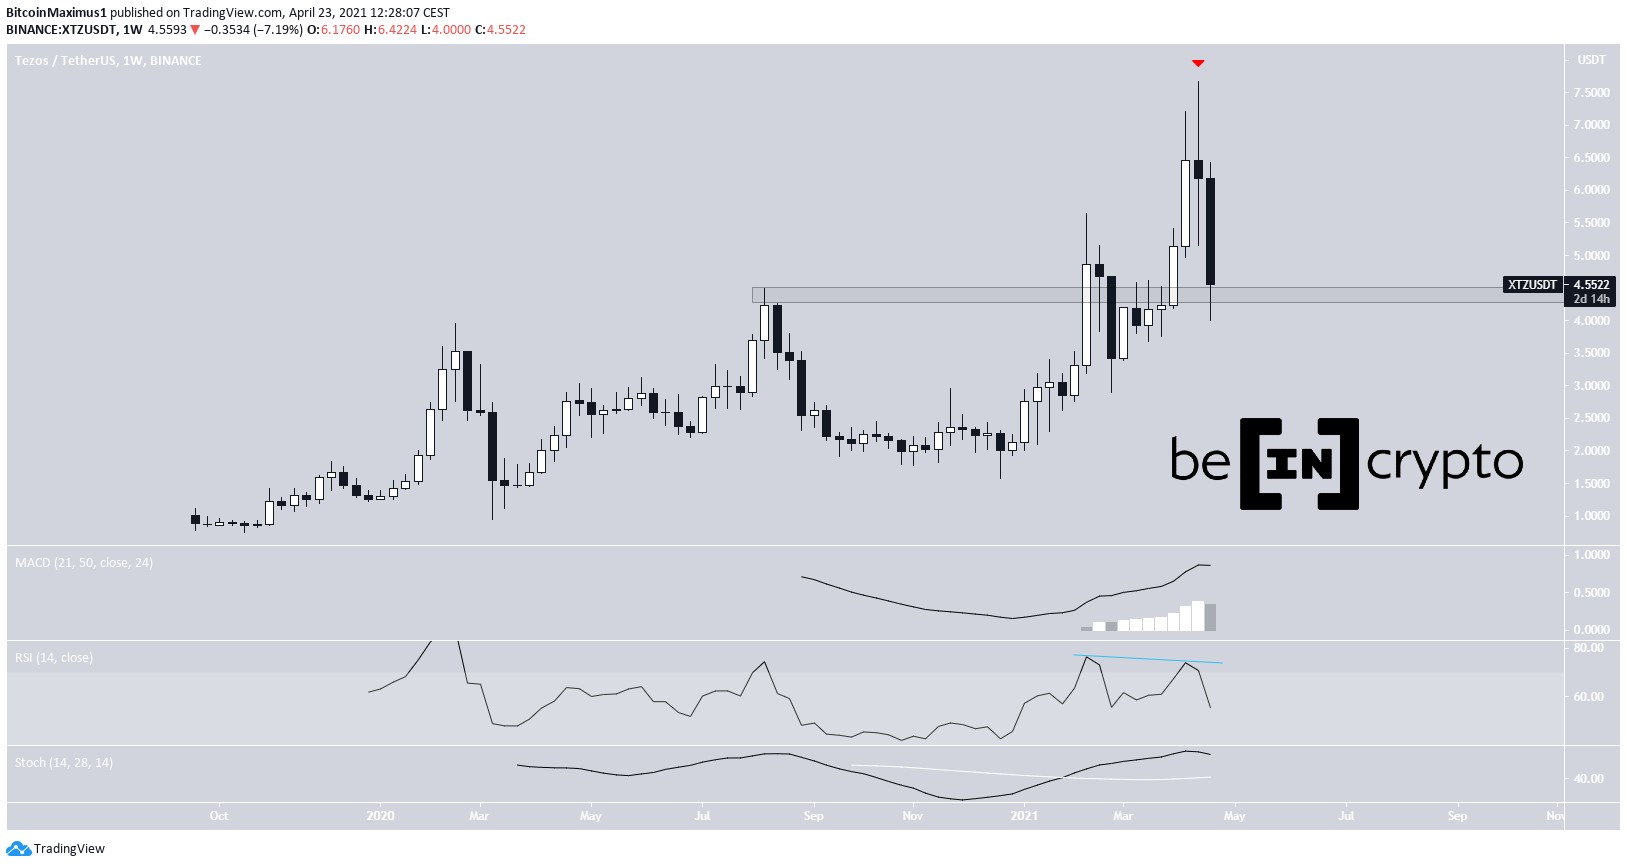
EOS Chart By Trading View Tezos (XTZ)The Tezos (XTZ) price has been decreasing since April 30, when it reached a high of $3.04. The decrease has taken the form of a descending wedge, which is known as a bullish reversal pattern.
However, technical indicators are still bearish. The RSI is well below the 50 line and has not yet generated any type of bullish divergence. Therefore, the price is expected to continue trading inside this wedge, possibly reaching the ascending support line that is currently at $2.4.
Afterwards, the price could break out and make another attempt at the $3 resistance area.
XTZ Chart By Trading View Chainlink (LINK)On May 4, the LINK price broke down from an ascending channel, one inside which it had been trading in since April 13. The breakdown was also supported by a RSI movement below the 50 line, a sign that the trend is bearish.
LINK Chart By Trading ViewTherefore, the LINK price is expected to decrease all the way to the ascending support line, which currently is at $3.3.
The post Crypto Price Analysis May 4: BTC, ETH, XRP, BCH, BSV, LTC, BNB, EOS, XTZ, LINK appeared first on BeInCrypto.
origin »Bitcoin price in Telegram @btc_price_every_hour
Bitcoin (BTC) на Currencies.ru
|
|