2020-11-7 13:00 |
Bitcoin has seen a strong surge over the past three weeks, moving from $11,200 to a high of $15,300. That is a 36.5% gain in the span of twenty days, making it the best-performing asset over that time frame.
While some are expecting a retracement from here, on-chain data shows that the market can sustainably move higher. This counteracts the strong sentiment shared by some commentators that Bitcoin is clearly overextended to the upside.
Related Reading: Here’s Why Ethereum’s DeFi Market May Be Near A Bottom Bitcoin Could Soon Move Even Higher, On-Chain Trends SuggestBitcoin’s rapid move to the upside has left many wondering if large investors will pay themselves and take profit. There have already been rumors shared on Twitter that certain traders and whale Bitcoin addresses have been liquidating coins in anticipation of a strong correction.
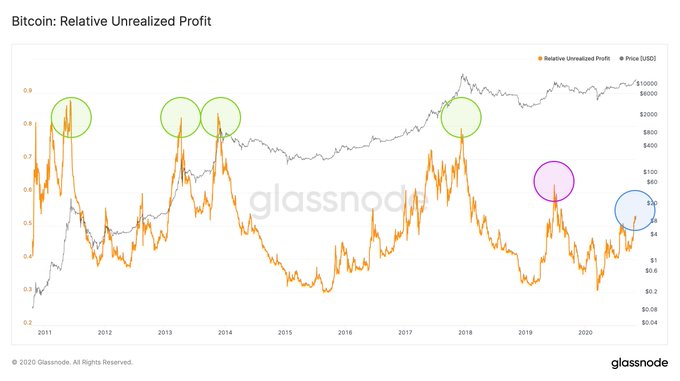
But according to Rafael Schultze-Kraft, CTO of prominent data firm Glassnode, Bitcoin has room to sustainably rally from here. He shared data from his firm showing that the Relative Unrealized Profit of Bitcoin is currently far from bubble levels:
“#Bitcoin Relative Unrealized Profit: – Previous global tops were hit at around 0.8 – Last year’s local top at $13k was hit at 0.64 – Now we’re at around $15k and current level is only 0.53 Still plenty of room to grow, this is bullish.”
As the chart shows, the last time this metric was this high was in the middle of 2019’s rally, when BTC was trading for $8,000-10,000. The metric holding these lows despite Bitcoin’s price surging higher indicates that BTC will continue higher before serious profit-taking takes place.
Chart of BTC's macro price action with a relative unrealized profit analysis by Glassnode and Rafael Schultze-Kraft Related Reading: Tyler Winklevoss: A “Tsunami” of Capital Is Coming For Bitcoin Don’t Count Out a Drawdown or CorrectionAnalysts say that it would be unwise to count out a drop from here, though, or at least a period of consolidation for Bitcoin.
The chart below was shared by an analyst during Bitcoin’s latest leg higher. It suggests that the cryptocurrency has a good chance of reversing here due to a historical indicator.
Chart of BTC's price action over the past few months with analysis by crypto trader HornHairs (@Cryptohornhairs on Twitter). Source: BTCUSD from TradingView.com Related Reading: 3 BTC On-Chain Trends Show a Macro Bull Market Is Brewing Featured Image from Shutterstock Price tags: xbtusd, btcusd, btcusdt Charts from TradingView.com Crucial On-Chain Data Shows Bitcoin's Rally to $15k is Just the Start origin »Bitcoin price in Telegram @btc_price_every_hour
Bitcoin (BTC) на Currencies.ru
|
|