2022-11-17 14:15 |
The Cosmos (ATOM) price is trading inside a Fib and horizontal support level. There are no decisive signs in either direction.
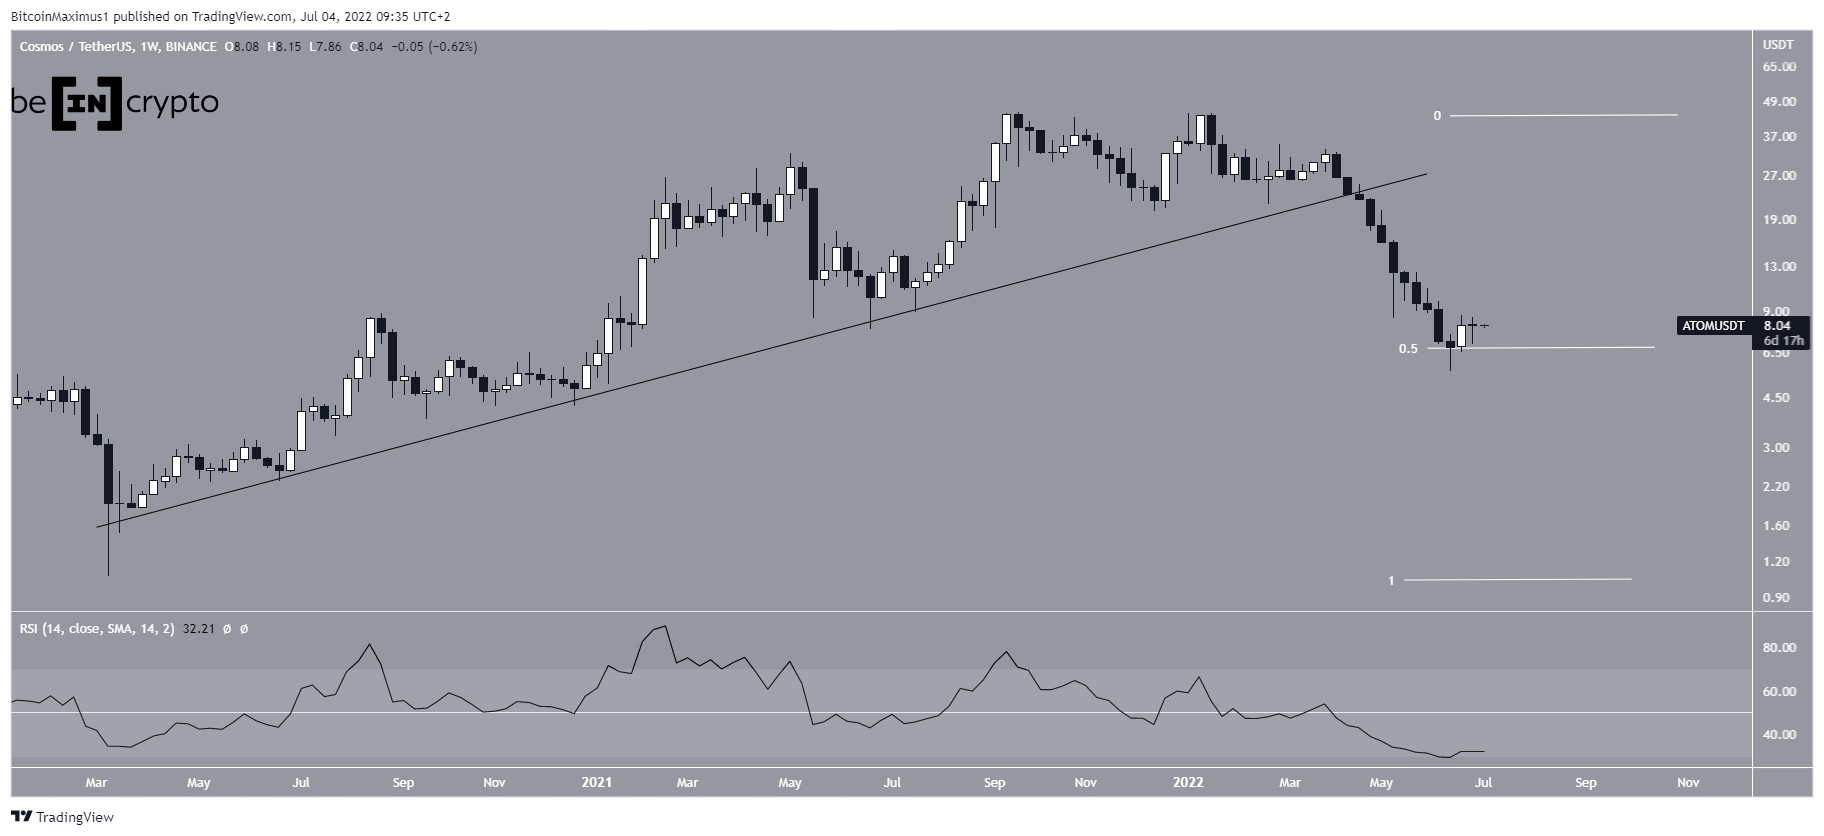
ATOM is the native token of the Cosmos ecosystem. The ATOM price has fallen since reaching an all-time high price of $44.65 in Sept. 2021. It created a lower high in Jan. 2022 before accelerating its rate of decrease. Until now, Cosmos fell to a minimum price of $5.55 in June 2022.
The price of Cosmos initiated a bounce afterward that is still ongoing.
A significant development is reclaiming the long-term $8.80 horizontal support area. The area has intermittently acted as resistance and support since July 2020 (red and green icons). So, the June breakdown (red circle) is only a deviation due to the subsequent reclaim.
The weekly RSI is below 50 despite the ATOM price is trading above the $8.80 support area. So, whether the price breaks down or bounces will likely determine the future ATOM price prediction.
ATOM/USDT Chart By TradingView Cosmos (ATOM) Price Rise Loses MomentumThe daily time frame shows two other important resistance and support levels. Firstly, the ATOM price has followed a descending resistance line since Sept. 9. The line rejected ATOM on Nov. 5.
Afterward, the price fell to the 0.618 Fib retracement support at $10. This is both the 0.618 Fib retracement support level and a horizontal support area.
However, the daily RSI is bearish since it is below 50. As a result, whether the ATOM price breaks down from the $10 area or bounces will determine the future trend.
ATOM/USDT Chart By TradingView Wave Count Supports Bounce?The wave count supports the possibility of a bounce. It shows that the ATOM price has completed an A-B-C corrective structure.
The fact that the waves have a nearly 1:1 ratio and the overlap (red line) of waves A and C support this being the correct count.
However, the count would be invalidated with a decisive close below the $10 support area. In any case, the wave count only suggests a short-term increase will follow, rather than a long-term bullish reversal. As a result, the direction of the long-term trend is unclear.
ATOM/USDT Chart By TradingViewFor BeInCrypto’s latest Bitcoin (BTC) analysis, click here.
Disclaimer: BeInCrypto strives to provide accurate and up-to-date information, but it will not be responsible for any missing facts or inaccurate information. You comply and understand that you should use any of this information at your own risk. Cryptocurrencies are highly volatile financial assets, so research and make your own financial decisions.
The post Cosmos (ATOM) Price Stays Steady Above Support, but Fear of Collapse Remains appeared first on BeInCrypto.
origin »Bitcoin price in Telegram @btc_price_every_hour
Lendroid Support Token (LST) на Currencies.ru
|
|