2020-12-14 10:28 |
Litecoin price is up over 5% and it broke the main $80.00 resistance against the US Dollar. LTC is showing positive signs and it could continue to rally towards $90.00 or $95.00.
Litecoin started a strong increase above the $74.00 and $75.00 resistance levels against the US Dollar. The price broke the main $80.00 resistance and settled above the 100 simple moving average (4-hours). There was a break above a major bearish trend line with resistance near $80.60 on the 4-hours chart of the LTC/USD pair (data feed from Kraken). The price is consolidating above the trend line and it could continue higher above $82.00. Litecoin Price Smashes Key ResistanceIn the past two days, there was a fresh increase in bitcoin, Ethereum, ripple and litecoin against the US Dollar. LTC price formed a decent support base near the $70.00 level before starting a fresh increase.
It broke the $74.00 and $75.00 resistance levels to move into a positive zone. More importantly, the price broke the main $80.00 resistance and settled above the 100 simple moving average (4-hours). The price climbed above the 50% Fib retracement level of the downward move from the $92.69 swing high to $69.88 swing low.
There was also a break above a major bearish trend line with resistance near $80.60 on the 4-hours chart of the LTC/USD pair. Litecoin is now consolidating above the trend line, $80.00, and the 100 simple moving average (4-hours).
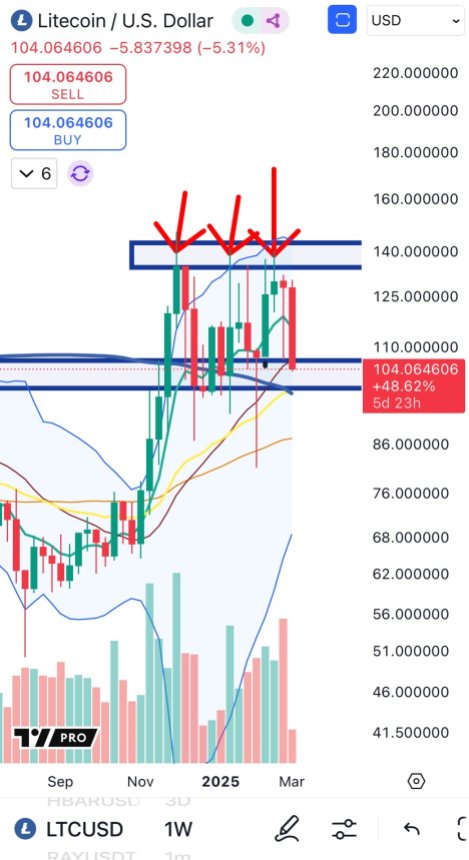
Source: LTCUSD on TradingView.comOn the upside, the price is facing hurdles near the $84.40 and $85.00 levels. The 61.8% Fib retracement level of the downward move from the $92.69 swing high to $69.88 swing low is also near $84.00.
A successful break above the $84.00 and $85.00 resistance levels could initiate a fresh increase. The next major resistance is near the $90.00 level, above which the bulls could aim a test of $95.00.
Dips Supported in LTC?It seems like litecoin is holding gains above the trend line and the $80.00 zone. If there is a downside break below the $80.00 support and the 100 simple moving average (4-hours), there could be a fresh decline.
The next major support is near the $76.00 level. Any further losses may perhaps send the price towards the $72.50 support in the coming sessions.
Technical indicators:
4-hours MACD – The MACD is slowly losing momentum in the bullish zone.
4-hours RSI (Relative Strength Index) – The RSI for LTC/USD is currently correcting lower from the 65 level.
Major Support Levels – $80.00 followed by $76.00.
Major Resistance Levels – $84.00 and $85.00.
origin »Bitcoin price in Telegram @btc_price_every_hour
Litecoin (LTC) на Currencies.ru
|
|