2020-10-20 10:48 |
Chainlink (LINK) started a fresh increase, but it struggled to clear the $11.00 resistance. There is now a risk of a sharp decline below $10.50 if there is no break above $11.00.
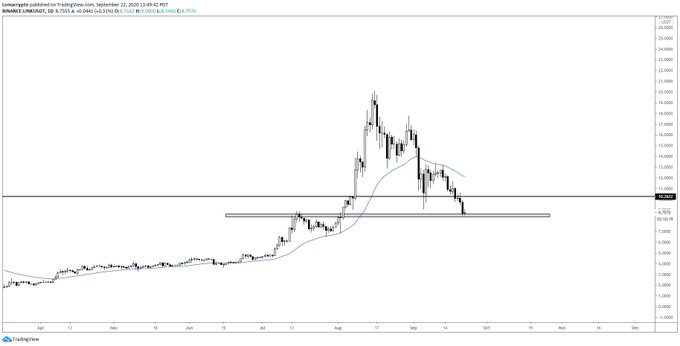
Chainlink token price is struggling to gain momentum above $11.00 and $11.10 against the US dollar. The price is still trading well above $10.50 and the 100 simple moving average (4-hours). There was a break above a major contracting triangle with resistance near $10.65 on the 4-hours chart of the LINK/USD pair (data source from Kraken). The pair could nosedive below $10.50 if it continues to struggle near $11.00. Chainlink (LINK) Price is Facing HurdlesAfter a test of the $11.80 resistance, there was a downside correction in chainlink (LINK) below $11.00. The price even broke the $10.50 support, but it remained well bid above the $10.25 support and the 100 simple moving average (4-hours).
A low is formed near $10.26 and the price is currently recovering higher. There was a break above a major contracting triangle with resistance near $10.65 on the 4-hours chart of the LINK/USD pair.
The pair broke the $10.80 resistance level, plus the 50% Fib retracement level of the downward move from the $11.82 high to $10.26 low. However, the price faced a strong resistance near the $11.00 and $11.10 levels.
Source: LINKUSD on TradingView.comIt seems like there was a rejection near the 61.8% Fib retracement level of the downward move from the $11.82 high to $10.26 low. The price is currently moving lower and trading with a bearish angle below $10.85. The next support is near the $10.50 level.
The main support is near the $10.25 level and the 100 simple moving average (4-hours), below which there is a risk of a sharp decline. The next major support is seen near the $9.60 level.
Fresh Increase?If chainlink’s price manages to stay above $10.50, there are chances of a clear break above the $11.00 resistance level. The bulls need to gain strength above $11.10 for a sustained upward move.
If they succeed, the price might even surpass the $11.50 level. The next major resistance is near the $11.80 zone, above which the bulls might aim a test of the $12.00 resistance in the near term.
Technical Indicators
4-hours MACD – The MACD for LINK/USD is now in the bearish zone.
4-hours RSI (Relative Strength Index) – The RSI for LINK/USD is declining and it is just below the 50 level.
Major Support Levels – $10.60, $10.50 and $10.25.
Major Resistance Levels – $11.00, $11.10 and $11.80.
origin »Bitcoin price in Telegram @btc_price_every_hour
ChainLink (LINK) на Currencies.ru
|
|