2020-9-1 15:03 |
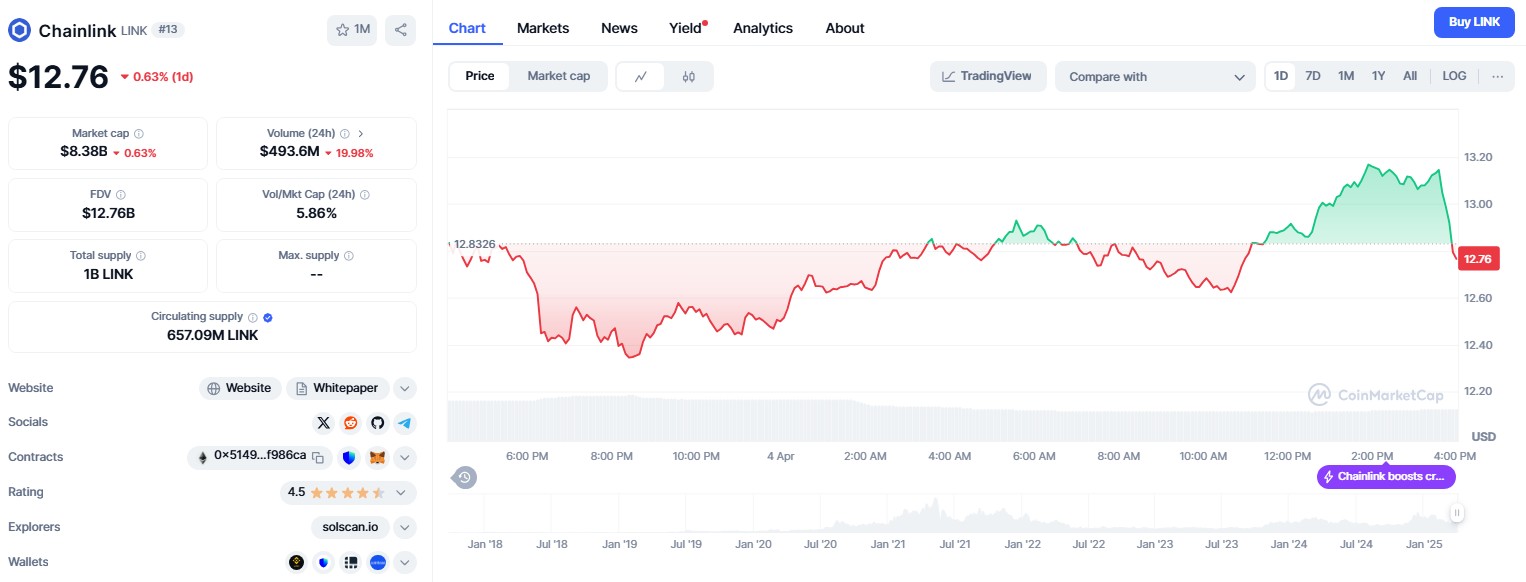
The Chainlink (LINK) price has been decreasing since reaching a high of $20.11 on Aug 16.
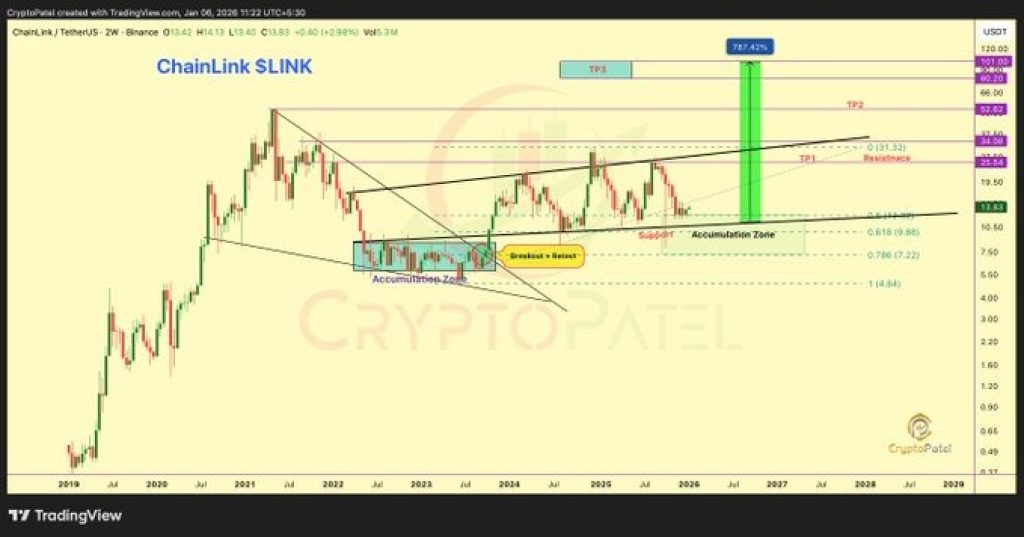
It’s likely that an almost three-year-long upward trend has ended and LINK has now begun what could be a potentially lengthy correction.
LINK Shows Long-Term WeaknessThe LINK price has been steadily increasing since October 2017, but it really started to accelerate at the beginning of March of this year.
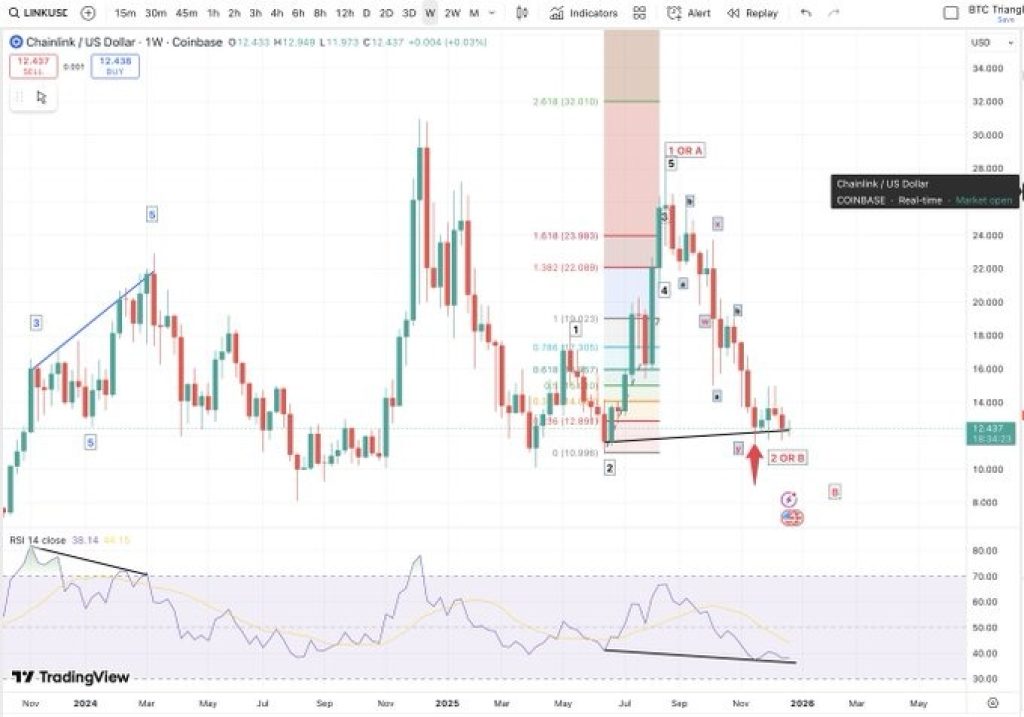
The weekly chart has begun to show some serious signs of weakness though. There is a bearish divergence in the RSI and Stochastic RSI, both of which are heavily overbought.
Furthermore, the MACD is decreasing after going parabolic for a period of time. All are signs that the long upward move has probably ended and that LINK is most likely entering a corrective period.
LINK Chart By TradingView Deviation Above Range HighThe daily chart shows that the price created what resembles a shooting star candlestick yesterday. A close below $14.91 would complete an evening star, which is considered a bearish reversal pattern.
Technical indicators provide a mixed outlook. While the short-term MACD is increasing and has given a bullish reversal signal, the long-term MACD is decreasing. A close below $14.22 would invalidate the bullish reversal signal given in the MACD.
LINK Chart By TradingViewYesterday, the price also reached a high above the $16.85 resistance but has fallen back below since.
This suggests that yesterday’s increase was a deviation above the range which will be followed by a decrease.
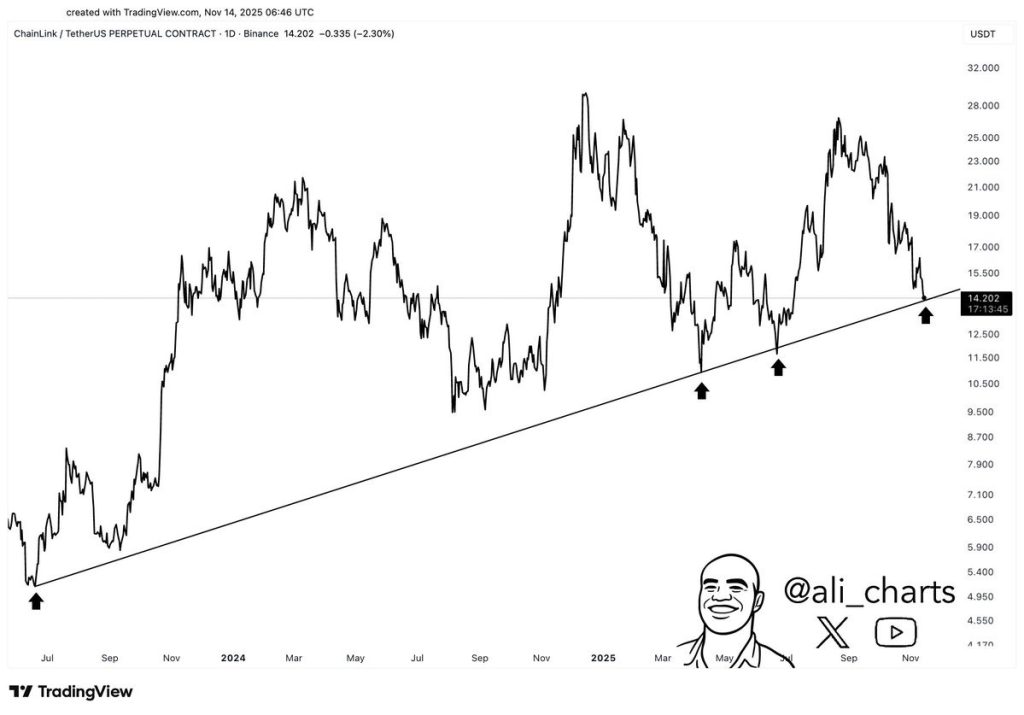
If so, the closest support area is found at $13.75.
LINK Chart By TradingView Wave CountCryptocurrency trader @Imkeshav outlined a LINK chart, stating that the current upward movement is corrective rather than impulsive and that the price will likely decrease towards $10.
Source: TwitterSince Aug 16, LINK has likely been completing an A-B-C correction, finishing wave B with yesterday’s high. The high was reached at the 0.618 Fib level of the previous downward move.
If the C wave has the same length as A, the price should indeed reach a bottom near $10.
LINK Chart By TradingViewFor BeInCrypto’s previous Chainlink (LINK) analysis, click here!
The post Chainlink’s (LINK) Massive Rally May Finally Be Kaput appeared first on BeInCrypto.
origin »Bitcoin price in Telegram @btc_price_every_hour
ChainLink (LINK) на Currencies.ru
|
|