2020-12-14 14:26 |
BTC bottomed out at $17,500 before an impressive weekend rally saw it retest resistance around $19,500
Bitcoin price spiked to highs of $19,400 after bottoming out near $17,500. The latest uptick to the $19,500 resistance level saw BTC dominance surge to 63%, with weekend gains for most altcoins pushing the global cryptocurrency market capitalisation to $563 billion.
For Bitcoin bulls, the main short term target remains cracking the $20,000 line. With prices around $19,100 at the time of writing, another $1000—candle up would do. However, on-chain data and technical indicators suggest a reversal to lows of $18,000.
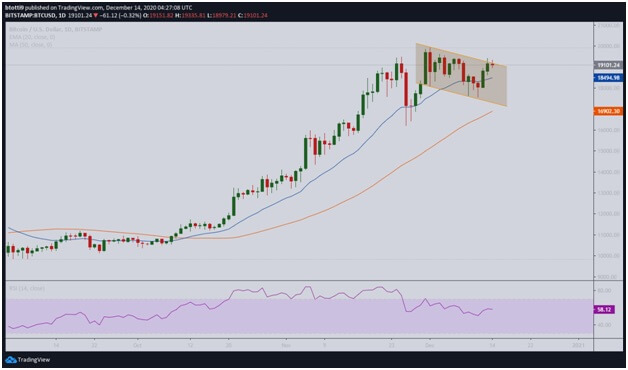
BTC/USDBitcoin’s dip under the 20-EMA ($18,494) this past week took its price to a likely bottom near $17,500. But as the daily chart shows, bulls managed to buy the dip to push prices above the moving average.
BTC/USD daily chart. Source: TradingView
It is this upward pressure that saw the BTC/USD pair settle above $19,000, with bulls running into resistance near $19,400.
Currently, buyers are battling downward pressure at the upper boundary of the descending channel ($19,100).
If bulls keep prices above the upper trendline of the channel, the next action could take BTC past the major overhead resistance level at $20,000.
The upsloping 20-EMA curve and the RSI remaining positive above 50 suggest bulls have the hunger to attempt a new high.
However, as shown on the 4-hour chart, bears are likely to stem the upside and drop prices to the 20-EMA or below.
A sell signal in the form of a green nine candlestick has appeared. A downturn from current levels could see BTC/USD drop to $18,815 (20-EMA). The trendline of an ascending triangle formation provides support around $18,200, with short term sell-off likely to push prices to the next support level at $17,500.
BTC/USD 4-hour chart. Source: TradingView
The weekly chart has also formed a hanging man candlestick pattern following last week’s panic selling. The appearance of the bearish reversal signal suggests bulls will likely struggle to break above the $19,500 resistance level.
BTC/USD weekly chart. Source: TradingView
‘Typical price reversal’On-chain data from crypto analytics platform Santiment reinforces the likelihood of a short term dip in Bitcoin price.
According to the firm, Bitcoin’s rebound to prices above $19k coincided with a spike in the number of dormant coins being moved to suggest inbound sell-off pressure.
“In the midst of Bitcoin making its return above $19k this weekend, our data identified the largest token consumed spike in 40 days. This indicates that large amounts of previously dormant $BTC have just been moved. Typically, price reversals occur following these spikes, and this one coincided with the latest price local top just above $19.3k 10 hours ago.”
The post BTC facing ‘typical price reversal’ after spiking to $19.4K appeared first on Coin Journal.
origin »Bitcoin price in Telegram @btc_price_every_hour
Bitcoin (BTC) на Currencies.ru
|
|


