2024-4-2 10:42 |
The BNB price could potentially react to recent market dynamics, notably as BNB Daily Transactions reached their lowest point since February 25. From March 31 to April 1, there was a significant shift in the SAR metric, transitioning from a bullish to a bearish pattern.
Concurrently, the EMA lines are showing a consolidation pattern. However, there’s a concerning trend where the short-term EMA lines are nearing the long-term ones, potentially leading to the formation of a death cross.
BNB Daily Transactions Are DecreasingSince January 2024, BNB has seen steady transaction volumes with some peaks. Its price, however, soared from $313 on January 1 to $632 by March 15. This jump, over just two months, represents a 101% increase. The rapid ascent indicates that BNB’s price is likely driven more by the overall bullish crypto market trend than by its fundamentals.
Compared to the top 21 cryptocurrencies by market cap—excluding memecoins and stablecoins—BNB’s year-to-date (YTD) growth is notable, only surpassed by Bitcoin Cash, TON, and Stacks. Yet, a recent fall in daily transactions and a drop in the 7-day moving average may signal waning investor interest in BNB.
BNB Daily Number of Transactions. Source: Dune.Its daily transactions reached a peak of 6.2M on February 22. However, in the last few days, that metric has been declining consistently. It decreased from 4.4M on March 28 to 3.6M on March 31. This is its lowest level since February 25.
This cooling sentiment could stem from its substantial gains earlier in the year, prompting investors to search for other ventures with potentially higher returns on investment (ROI).
Read More: Binance Coin (BNB) Price Prediction 2024/2025/2030
BNB SAR Metric Recently Changed Its StatusBetween March 28 and March 31, BNB experienced a bullish phase, evidenced by its SAR (Stop and Reverse) metric, during which its price climbed from $564 to $620.
The SAR metric is a technical analysis indicator used to identify potential reversals in the price direction of an asset. It appears as a series of dots on a chart, either above or below the price line, signaling bullish or bearish movements respectively.
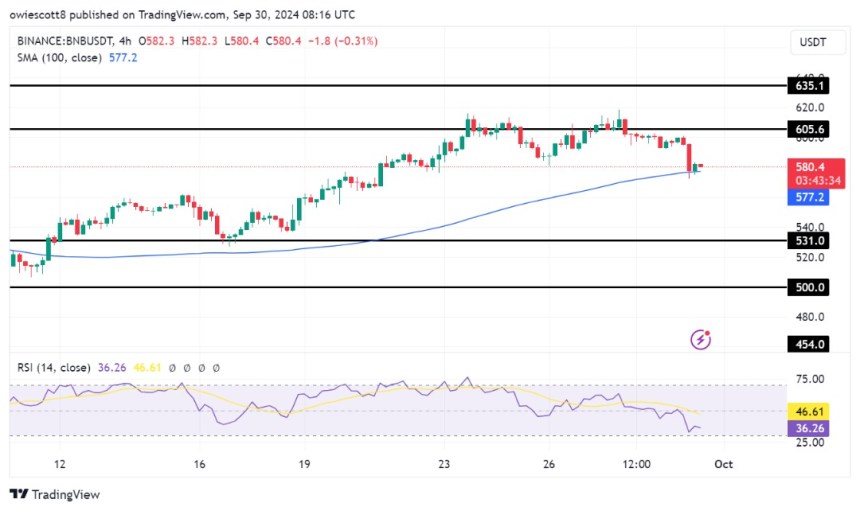
BNB 4H Price Chart, EMA Lines, and SAR. Source: TradingView.However, a significant shift occurred between March 31 and April 1, when the SAR metric transitioned from a bullish to a bearish state. The continuation of this bearish trend is indicated by the further decline of the dots, suggesting that BNB might be heading towards a period of stagnation or potentially entering a strong corrective phase soon.
This change in the SAR metric is crucial for investors, as it provides insight into the potential downward movement of BNB’s price, signaling caution in the short term.
BNB Price Prediction: Back To $500?The EMA lines for BNB are signaling a potential downtrend on the horizon as the short-term lines verge on crossing below the long-term lines, a phenomenon known as a death cross. This technical indicator is significant because it represents a bearish signal, often predicting a substantial price decline.
A death cross occurs when a shorter-term moving average falls beneath a longer-term moving average, showing weakening market momentum and potentially heralding a bearish phase for BNB’s price.
BNB 4H Price Chart and EMA Lines. Source: TradingView.EMA, or Exponential Moving Average, lines are a moving average that places a greater emphasis on recent price data compared to simple moving averages. This sensitivity to new data makes EMAs particularly useful for identifying trend directions more promptly. Given the imminent bearish signal from the death cross, BNB’s price might soon test the critical support level of $535.
Read More: BNB: A Comprehensive Guide to What It Is and How It Works
Should this level fail to hold, the next potential floor is at $498, indicating a further retreat. Conversely, should BNB manage to reverse its fortunes and enter an uptrend, investors will likely see it challenge the resistance levels at $620 and, subsequently, $645, marking key thresholds for potential price recoveries.
The post BNB Price Analysis: Is a Correction Below $500 Imminent? appeared first on BeInCrypto.
origin »Bitcoin price in Telegram @btc_price_every_hour
Binance Coin (BNB) на Currencies.ru
|
|