2019-12-9 15:00 |
Is the bottom in? Since Bitcoin (BTC) fell precipitously to $6,600 late last month, analysts have been asking if the leading cryptocurrency has finally found a price bottom after a multi-month downturn.
According to a number of fractal analyses, which is comparing an asset’s historical price action to its current price action, the bottom just might be in.
Related Reading: Crypto Tidbits: Deutsche Bank Gives Nod to Bitcoin, EOS to Host Social Media, France Digital Currency Bitcoin Bottomed at $6,600, Analyses ImplyThis weekend, this outlet reported on trader Jonny Moe’s analysis that Bitcoin is forming an Adam & Eve double bottoming pattern, marked by a strong sharp drop and rebound (the Adam) and a rounded downward move (the Eve).
While this is bullish in and of itself, as it’s a traditional bottoming pattern seen across assets, analyst Crypto Bullet noted in a recent TradingView post that a very similar trend was seen at the bottom of the bear market nearly one year ago: “after that ultimate low we consolidated and formed Adam & Eve Pattern, which we broke out of in April.”
It isn’t only Crypto Bullet that has observed eerie similarities between the current Bitcoin price chart and the one seen during the accumulation phase less than a year ago.
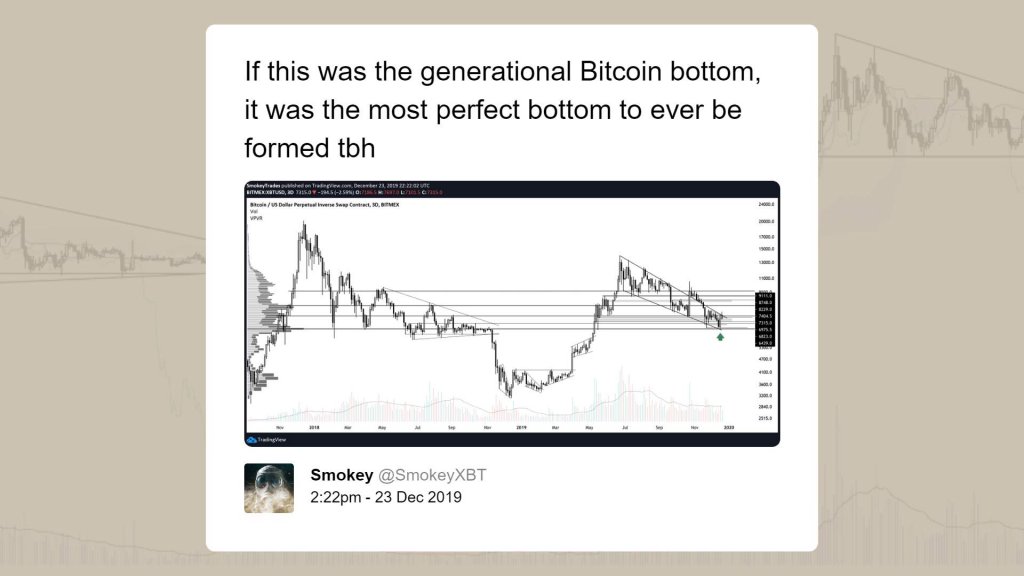
Top trader Cantering Clark recently observed an “uncanny resemblance” between the BTC price action seen over the last few days and the aforementioned accumulation phase. Indeed, as Clark’s two charts seen below show, the Bitcoin price action seen then and now are very similar directionality-wise, with there being drops now where there were drops in late-2018 and such.
“It would make sense that after the first major move up, that the first major correction and following accumulation period would have a fractal resemblance to the larger original,” Clark elaborated, pointing out the intricacies of the potential fractal poised to play out in real-time.
There is an uncanny resemblance between these two charts.
It would make sense that after the first major move up, that the first major correction and following accumulation period would have a fractal resemblance to the larger original.
The purpose is still the same.$BTC pic.twitter.com/eRQA9PRJSZ
— Cantering Clark (@CanteringClark) December 9, 2019
Related Reading: 15% Jump to $8,500 on the Table for Bitcoin Price; Analyst Explains Why Fundamentals, Too, Support BullsThe fundamentals support this. Per previous reports from NewsBTC, Adaptive Capital’s Willy Woo, a popular on-chain metrics analyst, noted on Dec. 7 that a proprietary indicator his fund uses is implying that the usage of the Bitcoin network is implying that bulls will soon gain the upper hand again:
“On-chain momentum is crossing into bullish [territory]… The bottom is most likely in, any [move] lower will be just a wick in the macro view.”
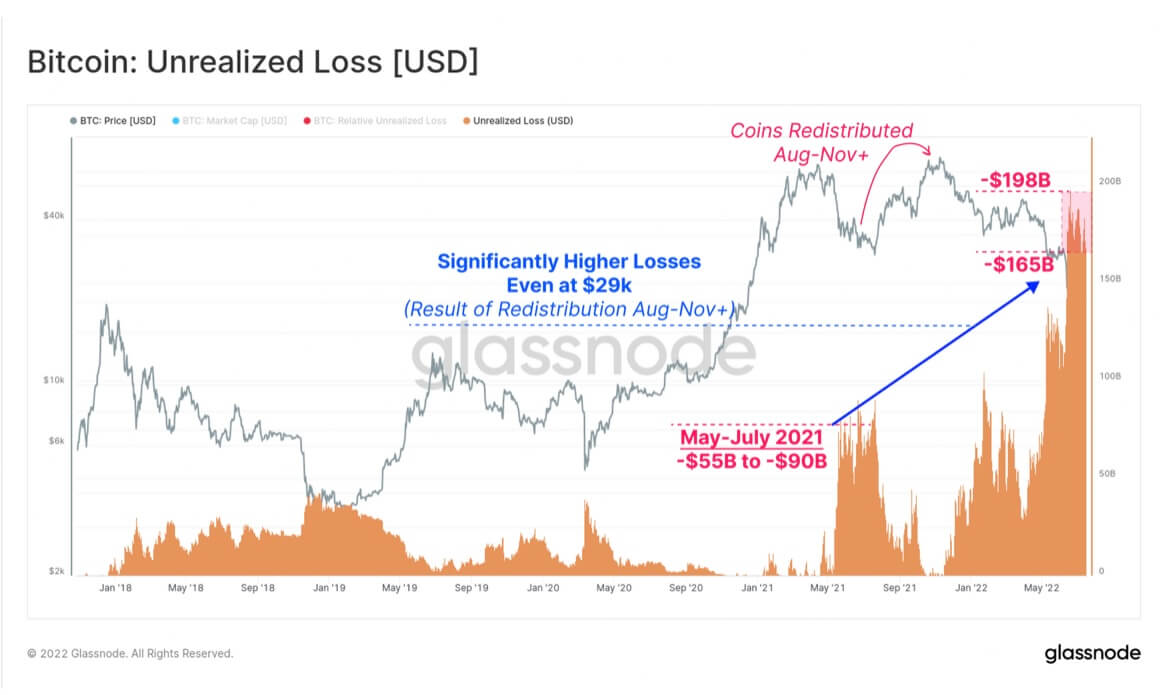
This lines up from sentiment from Glassnode, a crypto-centric on-chain intelligence firm, which noted just recently that their metrics suggest that Bitcoin is bottoming and slated to revert higher in a “strong” fashion.
One such metric that Glassnode drew attention to was that the Market Value to Realized Value (MVRV), the ratio between market cap and realized cap, is “consolidating towards one,” which implies that gains are being realized by crypto asset investors. A reading of one for the ratio often marks a bottom for the cryptocurrency market.
All this would suggest that the pain is over for bulls, at least until the fractals and on-chain market trends break.
Featured Image from ShutterstockThe post Bitcoin’s Chart Looks Eerily Similar to $3,000 Bottom; Is the Pain Over? appeared first on NewsBTC.
origin »Bitcoin price in Telegram @btc_price_every_hour
Bitcoin (BTC) на Currencies.ru
|
|