Bitcoin wrestles with key technical indicators as $28k proves a formidable resistance

Bitcoin wrestles with key technical indicators as $28k proves a formidable resistance
фото показано с : cryptoslate.com

2023-10-16 13:00

Quick Take

Bitcoin is currently grappling with a pivotal price point. With a value just shy of $28,000, it is up against several short-term technical indicators.

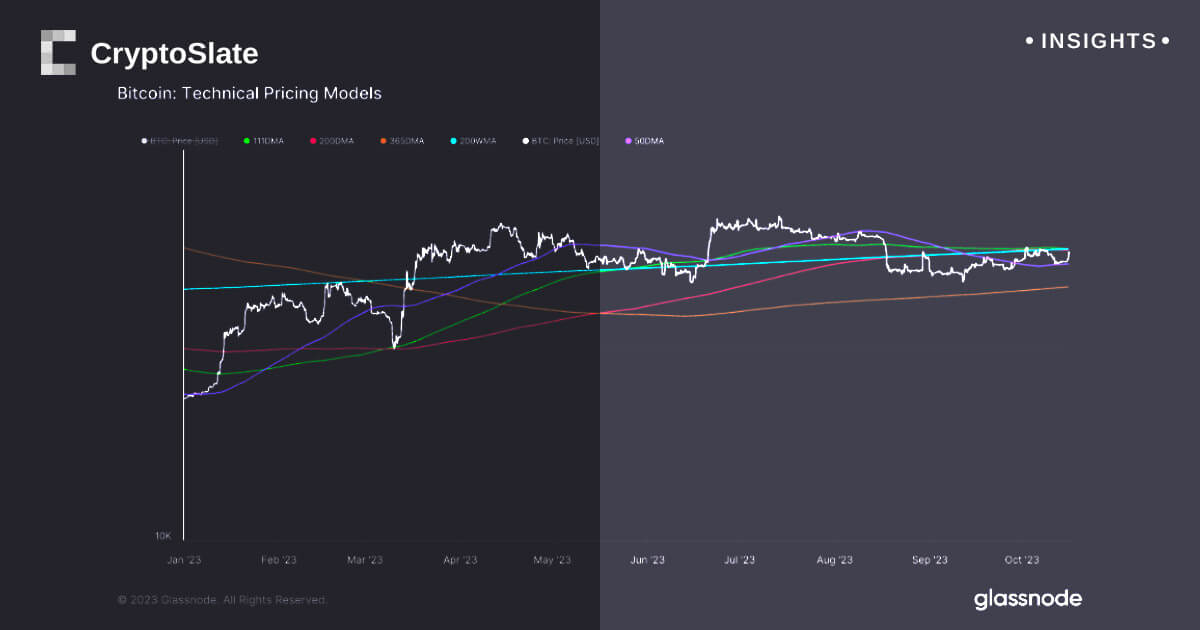
The 200-week moving average now stands at $28,130, while the 200-day moving average is slightly lower, at $28,008. The 111-day moving average is also positioned at $28,099, further complicating the short-term market outlook.

Over the last week, Bitcoin has followed the 50-day moving average, currently at $26,660.

Technical Pricing Models: (Source: Glassnode)

Another obstacle comes from the short-term holder’s realized price, which is presently valued at $27,830. This metric represents the average on-chain acquisition price for coins, excluding those in exchange reserves, moved within the last 155 days. Coins falling under this category are the most likely to be spent on any given day. Since falling under this threshold on Aug. 17, Bitcoin has encountered resistance numerous times.

Bitcoin has obeyed the short-term holder’s realized price several times this year, notably during the SVB collapse in March and again in June.

Short Term Holder Cost Basis: (Source: Glassnode)

Indicators used in this article are for past trend analysis only and should not be considered financial advice.

The post Bitcoin wrestles with key technical indicators as $28k proves a formidable resistance appeared first on CryptoSlate.

Similar to Notcoin - TapSwap on Solana Airdrops In 2024

origin »

Moving Cloud Coin (MCC) на Currencies.ru

$ 7.69E-5 (-0.86%)
Объем 24H $0
Изменеия 24h: 2.58 %, 7d: 13.77 %
Cегодня L: $7.69E-5 - H: $7.69E-5
Капитализация $0 Rank 3511
Доступно / Всего 0 MCC

moving bitcoin indicators average technical 200-week against

moving bitcoin → Результатов: 126


Фото:

How Bitcoin Could Reach $5 Million Per Coin

On Oct 15, for the first time in three years, Bitcoin witnessed a bullish crossover of the 100- and 200-period moving averages on the three-day charts. However, the asset has so far failed to leverage that breakthrough and remains stuck in the $8,300s – the same spot where it has been over the past few […] The post How Bitcoin Could Reach $5 Million Per Coin appeared first on BeInCrypto.

2019-10-16 12:17


Фото:

For the Bitcoin Price to Reach $9200, the 200-Day Moving Average Must Be Breached

Moving averages (MA) are often very significant in determining future price movements. The price of an asset, like Bitcoin, often reacts to its MAs — either using them for support or resistance. The higher the number of times an asset reacts to an MA, the higher its significance — thus, the more likely it is […] The post For the Bitcoin Price to Reach $9200, the 200-Day Moving Average Must Be Breached appeared first on BeInCrypto.

2019-10-10 17:29


Фото:

Bitcoin Price Likely to Breakout Alongside S&P 500, Says Tom Lee

US stock index S&P 500 is moving towards new highs, and that can be a catalyst for another Bitcoin rally, says Thomas Lee, Head of Research at Fundstrat. Bitcoin to Benefit from Stock Market Confidence While the largest cryptocurrency has proven to have a low correlation with traditional markets, a stock market rally could add to the overall confidence of investors, and that might be a boost for Bitcoin as well.

2019-10-10 14:00


Фото:

Did Bitcoin Crash Or Dip? Crypto’s Trajectory Moving Forward

Given the decline of cryptocurrency markets over the past week, it may be a good time to put things into perspective about the latest dip. While the usual advice to ‘zoom out’ is scant comfort during a bear season, it may be reassuring to note that many of bitcoin’s metrics are still in an upwards […] The post Did Bitcoin Crash Or Dip? Crypto’s Trajectory Moving Forward appeared first on Crypto Briefing.

2019-9-28 21:31


Bitcoin Price Breaks Below $8,000 Just Days After Triangle Breakdown

Bitcoin price is currently below $8,000 just days after breaking down from a multi-month triangle pattern where it was consolidating. With Bitcoin now trading below $8,000, where could the leading crypto asset by market cap go next for targets? Bitcoin Price Trades Below $8,000, Breaking Through 200-Day Moving Average Bitcoin price is currently free-falling, trying.

2019-9-26 19:13