2025-11-25 14:00 |
A cryptocurrency analyst has pointed out how a technical analysis (TA) signal that led into major price declines in the past has returned for Bitcoin.
Monthly MACD Has Turned Bearish For BitcoinIn a new post on X, analyst Ali Martinez has talked about a signal that has formed in the Moving Average Convergence/Divergence (MACD) for Bitcoin. MACD is a TA indicator that’s generally used for timing buys and sells in an asset’s price chart.
The indicator consists of two lines: MACD line and signal line. The first of these, the MACD line, is found by subtracting the 26-period exponential moving average (EMA) of the price from its 12-period EMA. The signal line tracks the 9-period EMA of this difference.
Crossovers between the two lines can provide buy or sell signals for the asset. The MACD line breaking above the signal line could be considered a bullish signal, while the reverse type of crossover a bearish one.
Now, here is the chart shared by Martinez that shows how the monthly MACD has changed for Bitcoin over the last several years:
As displayed in the above graph, the Bitcoin MACD has registered a crossover recently. The MACD line has plunged as the asset has witnessed its bearish momentum and it’s now sitting under the signal line.
As mentioned earlier, such a signal can be a bearish one. In the chart, the analyst has highlighted the past instances of this pattern. It would appear that the last three sell signals from the indicator all led into declines of more than 60% for the cryptocurrency.
“If that repeats, the chart points to $40,000,” noted Martinez. It now remains to be seen whether the MACD will hold for Bitcoin, or if a different trend from the past will follow this time around.
The MACD line falling under its signal line isn’t the only bearish crossover that BTC has faced recently. As the analyst has pointed out in another X post, a classic death cross has also appeared between the asset’s 50-day simple moving average (SMA) and 200-day SMA.
From the chart, it’s apparent that the 50-day SMA has declined below the 200-day SMA alongside the latest Bitcoin market downturn. During the past couple of years, each such signal has marked local bottoms for BTC, but in 2022, this crossover kicked off the bear market.
So far since the death cross has appeared, the asset has continued to decline, a potential sign that this death cross may be different from the recent ones.
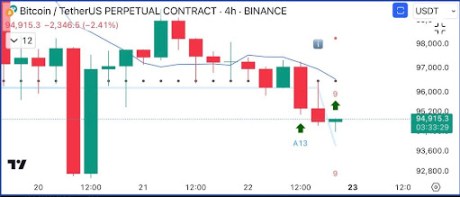
BTC PriceAt the time of writing, Bitcoin is floating around $88,800, down over 4% in the last seven days.
origin »Bitcoin price in Telegram @btc_price_every_hour
Bitcoin (BTC) на Currencies.ru
|
|