2023-2-9 06:28 |
Bitcoin price failed again and declined below $23,000. BTC is moving lower and might decline further below the $22,500 support.
Bitcoin is moving lower from the $23,500 resistance zone. The price is trading below $23,000 and the 100 hourly simple moving average. There is a key bearish trend line forming with resistance near $22,980 on the hourly chart of the BTC/USD pair (data feed from Kraken). The pair could accelerate lower if there is a close below the $22,500 support zone. Bitcoin Price Trims GainsBitcoin price attempted an upside break above the $23,500 resistance zone. BTC bulls struggled to clear the $23,500 barrier. A high was formed near the $23,450 zone and the price started a bearish wave.
There was a move below the $23,200 and $23,000 levels. The decline gained pace below the $22,800 level and the 100 hourly simple moving average. The price even spiked below $22,500. A low is formed near $22,418 and the price is now consolidating losses.
Bitcoin price is trading below $23,000 and the 100 hourly simple moving average. An immediate resistance is near the $22,660 level. It is near the 23.6% Fib retracement level of the recent decline from the $23,450 swing high to $22,418 low.
The next major resistance is near the $23,000 zone. There is also a key bearish trend line forming with resistance near $22,980 on the hourly chart of the BTC/USD pair.
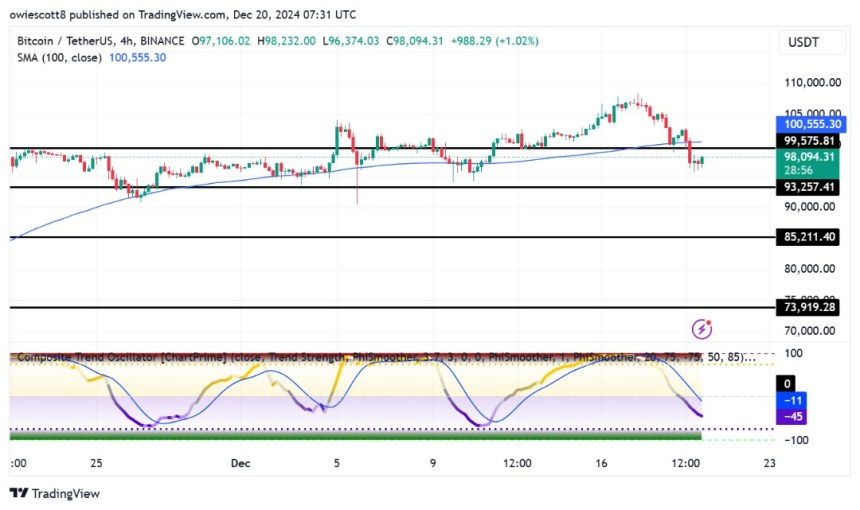
Source: BTCUSD on TradingView.com
The trend line is near the 50% Fib retracement level of the recent decline from the $23,450 swing high to $22,418 low. A clear move above the $23,000 resistance might start a decent increase. In the stated case, the price may perhaps rise towards the $23,500 level. The next resistance could be near the $23,650 level, above which btc price might rise towards the $24,250 resistance zone.
More Losses in BTC?If bitcoin price fails to clear the $23,000 resistance, it could continue to move down. An immediate support on the downside is near the $22,500 zone.
A close below the $22,500 support might spark bearish moves. The next major support is near the $22,200 zone. A downside break below the $22,200 zone might send the price towards the $21,500 zone.
Technical indicators:
Hourly MACD – The MACD is now gaining pace in the bearish zone.
Hourly RSI (Relative Strength Index) – The RSI for BTC/USD is now below the 50 level.
Major Support Levels – $22,500, followed by $22,200.
Major Resistance Levels – $23,000, $23,500 and $23,650.
origin »Bitcoin price in Telegram @btc_price_every_hour
Bitcoin (BTC) на Currencies.ru
|
|