2019-7-16 16:01 |
Over the last 6 Days Bitcoin has seen a 25% pull-back to visible range support around $9,800 from the recent high of $13,200. During this pull-back, another falling wedge has formed visible on all timeframes and could propel price levels back up towards visible range highs over the coming weeks.
Bitcoin 4 Hour AnalysisOn the 4 Hour chart, we can see the two falling wedges that have formed within the same price range as each other. Maxx Momentum indicator also shows similarities as momentum turns red throughout the later stages of the falling wedge towards the breakout. Both the 50MA and 200EMA have been gradually moving closer to each other over the last few weeks showing that the current trading range for BTC is very strong could very well be a period of consolidation before another big move to the upside.
Within the last few hours, price action has broken out of the most recent falling wedge as price levels look to retest the breakout point at $10,700. Both moving averages have also cut through and have broken out of the falling wedge. Volume has remained quite high and also appears to be descending which is an indication of strength around current price levels, as typically descending volume causes price levels to break down out of the trading range. I touched on the current trading range in more depth in my previous analysis here.
Bitcoin 1 Hour AnalysisOn the 1 Hour chart, we can now see a close-up image of the recent breakout around $10,700. There’s been no real increase of volume during the breakout, leading me to believe bearish momentum that resulted in the falling wedge being formed has run out of fuel. POC (Point of Control) currently sits around $11,630 which appears to be the next main resistance point for BTC and would be a likely stop if bullish momentum builds up as a result of the breakout.
Given two falling wedges which are a notoriously reliable bullish trading pattern have formed during a very strong bullish uptrend on BTC within the same range as each other this is a very strong sign that further upside is the most likely outcome. Many traders are calling for lower lows and for the current trading range to be broken but there’s little to no technical aspects to back this up.
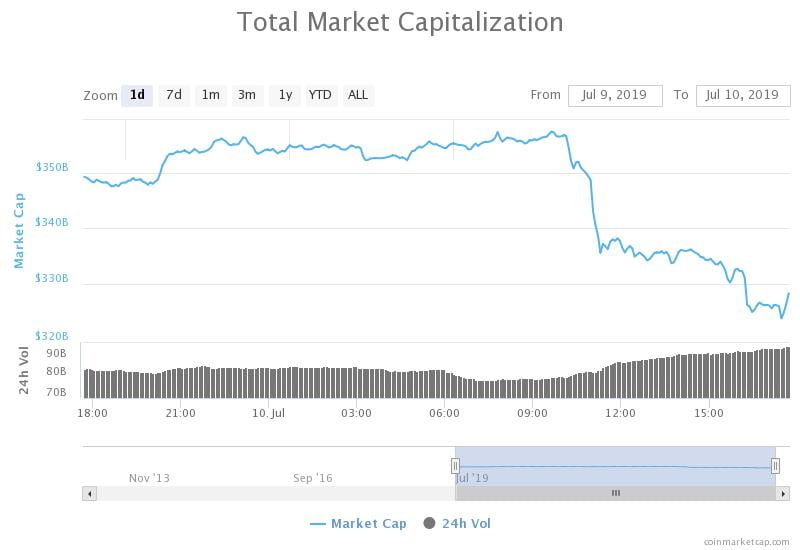
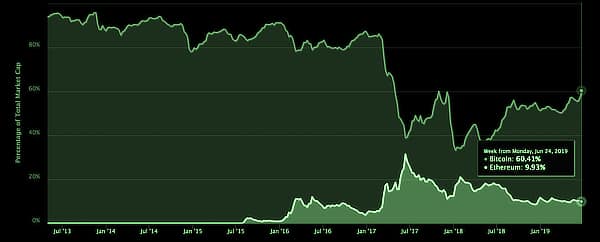
BTC dominance is currently a whopping 66% as altcoins continue to dive to lower lows week in, and week out. Providing BTC dominance stays well above that 63% threshold alts will continue to drop further and BTC will likely continue trading at high volume.
Do you think the repeating falling wedge patterns on BTC will result in higher highs in the coming weeks? Please leave your thoughts in the comments below!
Images courtesy of Tradingview, Shutterstock
The post Bitcoin Price Analysis: Bullish Falling Wedge Remerges appeared first on Bitcoinist.com.
origin »Bitcoin price in Telegram @btc_price_every_hour
Bitcoin (BTC) на Currencies.ru
|
|