Bitcoin Monthly Closes Above The Clouds For First Time Since 2016

2020-9-1 20:00

Last night, Bitcoin closed out August and opened September with a new candle. At the same time, the leading cryptocurrency by market cap also closed its first monthly candle above the Ichimoku cloud since 2016.

That year, BTCUSD closed above the key level twice, unable to hold the first time around. On the second, successful attempt, the crypto asset rose more than 1500% over the next 12 months. Will Bitcoin hold and head off on a new uptrend, or is another retest of support necessary for the cryptocurrency to hold above the key level?

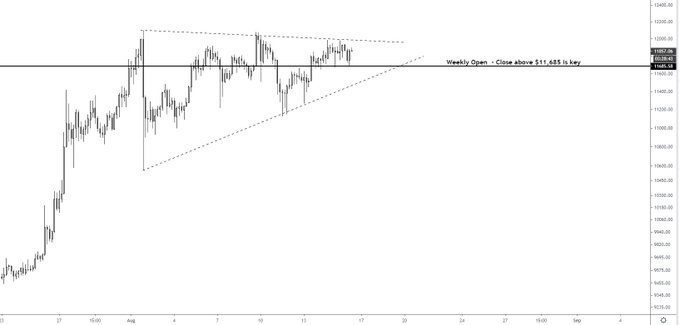
Ichimoku Provides Clear Perspective On Current Bitcoin Price Action, Pivotal Moment Ahead

Bitcoin price closed the August 2020 monthly candle at the highest point since the peak of the 2017 bull run. That pivotal monthly close in December 2017 at roughly $13,800 is the final resistance level before new highs, according to the Ichimoku indicator.

The indicator’s Chikou span is projected 26 sessions backward and shows where support and resistance lies (red dotted lines). The peak of the Chikou span marks the same monthly close.

Related Reading | Bitcoin Rally, Altcoin Season Take Crypto Market Recovery To Pre-Bear Market Levels

After Bitcoin took out that key resistance level during its last market cycle, it was off to the races, and the asset barely corrected from there on out. But before the cryptocurrency blasted above the crucial level, it first closed and held above the Ichimoku cloud or Kumo on monthly timeframes.

In the first attempt, the cryptocurrency closed – but couldn’t hold – above the Kumo on monthly timeframes.

The Kumo consists of both the Senkou span A and Senkout span B, which each act as resistance and support. Additionally, when these lines cross, it can give a powerful buy or sell signal.

BTCUSD Monthly Ichimoku Cloud 2016 - 2020 Comparison | Source: TradingView

Markets are considered bullish of the Senkou Span A is above the B span. On monthly timeframes, BTCUSD isn’t quite there yet. The B span is still higher, with about a $500 difference between them.

After Bitcoin lost the Ichimoku cloud on monthly timeframes back in 2016, the leading crypto asset fell sharply to the Senkou span B where nothing but a wick was left behind.

Related Reading | This Unique Perspective Makes It Clear Bitcoin Cycles Are Lengthening

Bulls stepped in to buy the dip with ferocity, propelling the cryptocurrency back above the cloud, through resistance, and soaring toward a new all-time high.

Conditions are slightly different this time around. During the last cycle, Bitcoin was considered bullish by the Senkou span crossover prior to the first attempt at holding above the Kumo.

The failure took the cryptocurrency down to the B span, which if happens again, would suggest a correction to $8,500. There, if history plays out the same, bulls would buy up the last major dip ever, and ride the position to a new record.

The Ichimoku indicator was created by Japanese journalist Goichi Hosoda. Ichimoku Kinko Hyo loosely translates to one glance equilibrium chart according to Wikipedia, due to how many different signals it can provide at just “one glance.”

This one glance look at Bitcoin shows a pivotal moment ahead, and one that could lead to either the last retest ever, or new highs. But which is it?

Similar to Notcoin - TapSwap on Solana Airdrops In 2024

origin »

Chronobank (TIME) на Currencies.ru

$ 29.29 (-0.51%)
Объем 24H $545.849k
Изменеия 24h: 1.40 %, 7d: -9.28 %
Cегодня L: $29.28 - H: $29.69
Капитализация $20.799m Rank 847
Цена в час новости $ 2.5076 (1068.05%)

time candle bitcoin closed above monthly cryptocurrency

time candle → Результатов: 75


Investor Greed Signals Bitcoin May Be Topping Despite Strong Monthly Close

Bitcoin was able to post an incredibly strong monthly candle close yesterday This marked the first time that the crypto had closed its monthly candle above $10,700 since mid-December of 2017 Shortly after the close took place, bulls stepped up and allowed BTC to set fresh 2020 highs of $11,800 It did face some heavy selling pressure at these highs that caused its price to see a sharp decline, but it has since stabilized Analysts […]

2020-8-1 19:00


It’s Decision Time for Bitcoin: These are the Price Levels Analysts are Targeting

Bitcoin has been firmly caught within a bout of consolidation over the past few days, largely hovering within the lower $9,000 region It appears that it is decision time for the cryptocurrency, as how its ongoing period of sideways trading resolves could set the tone for where it trends in the weeks ahead This next movement could be quite drastic, as some analysts are noting that it could result in a $1,000+ candle Bitcoin has […]

2020-5-24 19:00


Bitcoin (BTC) Plunges to $8,300; Here’s What Analysts Are Thinking

Bitcoin really hasn’t done well over the past day. After printing a false breakout candle on Saturday that brought the price of the asset to $9,200, there was a rapid and violent reversal. What followed was a dramatic and steep downtrend that has taken the price of BTC as low as $8,300 just last hour (as of the time of this article’s writing), marking a 10% drop from the highs.

2020-3-8 19:21


Bitcoin Plunges to Fresh Lows Under $8,400; $90 Million in BitMEX Longs Liquidated

Despite the strength seen earlier this week, Bitcoin started to plunge on Saturday. After printing a bearish “Darth Maul” candle that resulted in a crucial reversal at $9,200, the cryptocurrency has trended lower and lower, falling as low as $8,325 just minutes ago as of the time of writing this article. This marks a nearly...

2020-3-8 18:46


Фото:

Why Analysts Expect More Upside After Bitcoin Just Broke $10,000 (Again)

Over the past 36 hours, Bitcoin has finally started to show signs of strength after the brutal 10% sell-off earlier this week. From the week’s most traded price at $9,600, the cryptocurrency has pressed higher to $10,000 as of the time of writing this, seemingly to establish a short-term candle close above this crucial psychological level.

2020-2-24 03:37


Фото:

Crypto Volatility Returns – $25 Billion Dumped as Bitcoin Begins Pullback

Any asset that goes up by 65 percent in just a month needs to take a breather. Bitcoin is no exception and, after surging from $5,350 to a high of $9,000 in May, is due a correction. Bitcoin Price Drops Under $8K Bitcoin’s closing candle came in below $8,200 yesterday, which is a crucial level for maintaining support and remaining bullish in the short term.

2019-6-4 08:00


Key Bitcoin Metric Flashes Bullish for First Time in 442 Days

The bitcoin price just accomplished something it failed to do every day for more than a year, and it has speculators foaming at the mouth. For the first time in 442 days, in nearly 15 months, a positive candle of bitcoin was closed on a chart that uses a technical analysis method called the Ichimoku Cloud, a collection of indicators that demonstrate support and resistance levels.

2019-4-4 00:15


Фото:

Bitcoin Price Analysis: Low Time Frames Show Signs of Life Amid Weekly Tests

Bitcoin continues to coil tightly within its range-bound market as the bulls and bears fight it out to see which is most dominant. On the lower time frames (TF), bitcoin is managing to find support:Figure 1: BTC-USD, 2-Hour Candles, Low TF SupportThe zone outlined by the green line in Figure 1 represents local support that has kept the market afloat for the last week and a half.

2019-3-13 22:26


Фото:

Bitcoin Price Analysis: New High Paves Potential Reversal Setup

After days and days of consolidation, bitcoin finally managed to break a new high for the first time in almost two weeks. This new high, so far, has been short lived, however, as it was almost immediately sold into by eager bears:Figure 1: BTC-USD, 4-Hour Candles, New HighOur current 4-hour candle is seeing a relatively easy retracement after days and days of an upward grind.

2019-3-9 02:08


Фото:

Bitcoin Price Analysis: Keep an Eye Out for a Close Above the Current High

Shortly after falling from its test of the low $4,000s, bitcoin managed to find support in the mid $3,500s. This has proven to be a relevant level over the last few months, and finding support here would be a sign of relatively strong demand:Figure 1: BTC-USD, Daily Candles, Local SupportThe high candle spread rejection following our test of the low $4,000s was an indication that we had strong levels of supply left in the market, but for the time being we are holding support.

2019-3-1 03:44


Фото:

Bitcoin Price Analysis: Bullish Rejection Wipes Out Bitcoin’s Weekend Gains

Over the weekend, a strong rally was stifled by an even stronger rejection as the bitcoin market was shoved into a band of overhanging resistance. This band of resistance has been mentioned several times in our analyses over the last few weeks as it has proven impossible to overcome for the time being:Figure 1: BTC-USD, Daily Candles, Failed BreakoutThis run to the low $4,000s coincided with a breakout of a rather large symmetrical triangle consolidation shown above.

2019-2-26 02:42