2020-3-21 00:10 |
BeInCrypto has previously compared the rate of decrease of March to other bearish months. With this week’s increase, those numbers have changed. Below, we will take a look at monthly Bitcoin candlestick characteristics and compare them to previous bearish months.
Well-known trader @George1Trader outlined a BTC price chart, which shows the current BTC monthly candlestick, which is shaping up to have a massive lower wick that has taken the price inside of its previous support area.
$BTC
If this monthly closes like this…. pic.twitter.com/vECdk4bB3n
— George (@George1Trader) March 20, 2020
Bitcoin Candlestick SimilaritiesFor our criteria, we will take a look at candlesticks that had a bearish close and a long lower-wick. In addition, we will isolate those in which the candlestick had at least the same length as the body. There are four candlesticks that fit the criteria which took place in:
December 2013 January 2015 August 2016 March 2020With the exception of the candlestick in January 2015 which had a body and a wick of very similar length, the rest of the candlesticks had longer wicks than bodies.
Bitcoin Chart By Trading View
December 2013 & January 2015The monthly candlestick in December 2013 had a body that measured a decrease of 36% and a wick that measured 48%. In addition, it came after a very rapid price increase and had an RSI of 71.
The candlestick in January 2015 had a body decrease of 32% and a wick decrease of 29%. The monthly RSI was at 41 and the candlestick followed a downward trend that was ongoing since December 2013.
Therefore, these two candlesticks perfectly outline the downward trend, since they marked the beginning and end, respectively.
Based on the RSI values and prior movement, we can come to the conclusion that the December 2013 candlestick is dissimilar to the current candle, while the January 2015 monthly move shares some similarities.
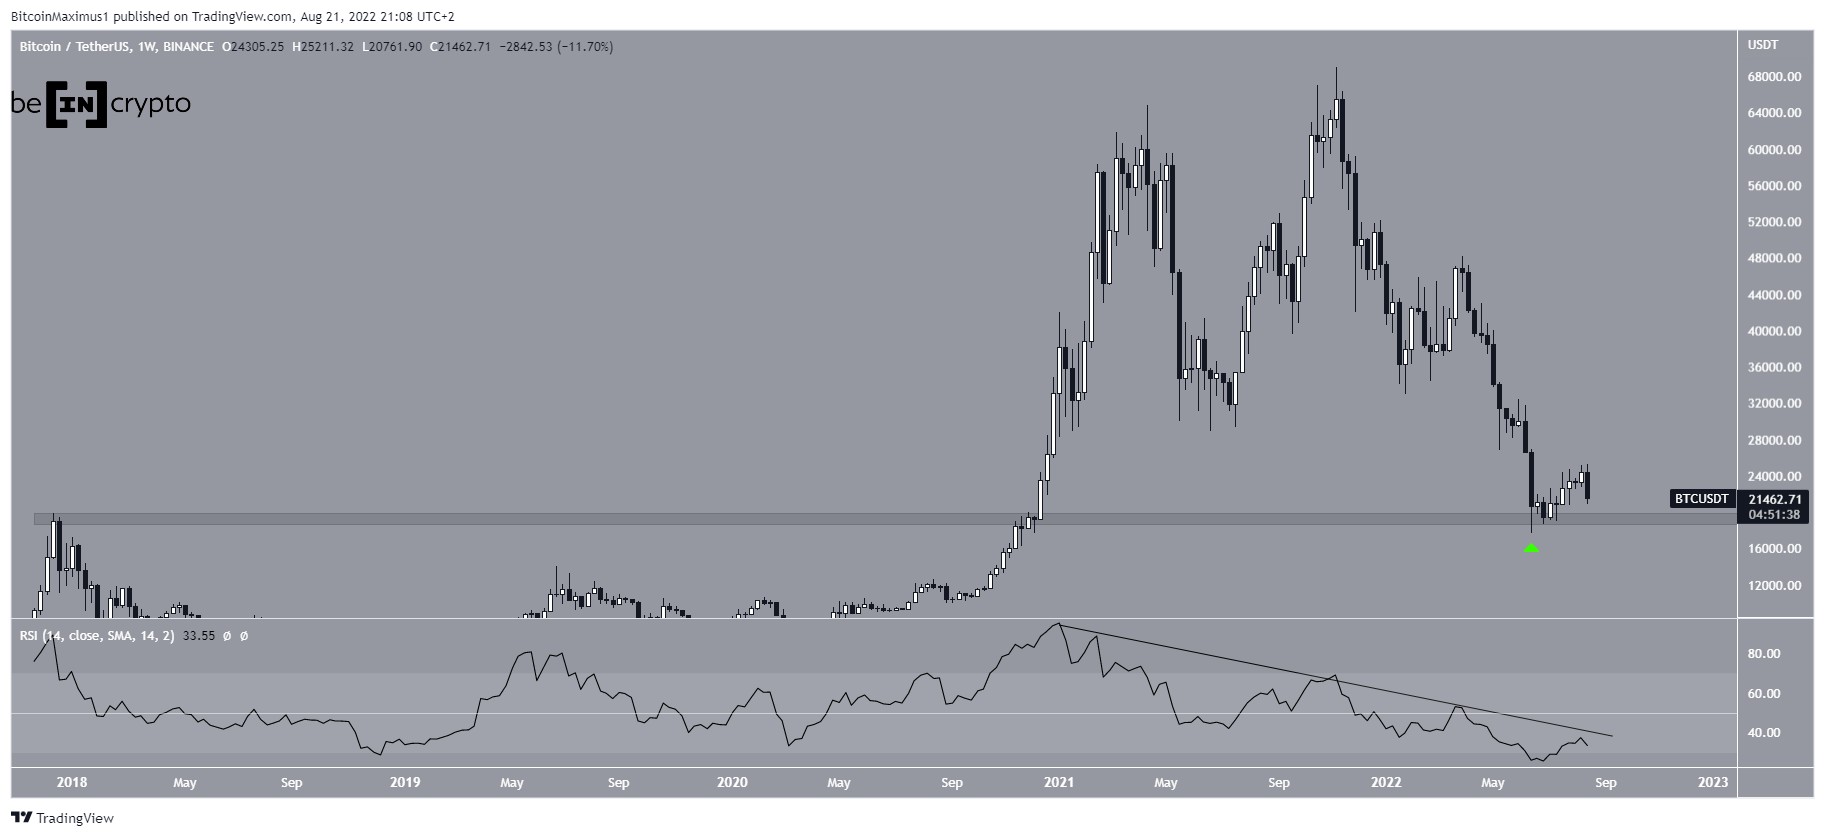
August 2016 & March 2020The August 2016 candlestick had a body of 8% and a long lower-wick of 18%. The monthly RSI was at 61 and the candlestick came after a period of increases.
The current candlestick, on the other hand, had a body that measured 23% and a lower-wick that measured 41%.
Therefore, these two candlesticks are quite similar to each other, especially when taking into account the ratio of bodies to wicks.
Therefore, if the monthly close is near or above this level, this decrease could prove to be only a short-term correction within a longer-term upward trend.
Bitcoin Chart By Trading View
In our previous article, the price was trading near $5,000 and we stated that a monthly close above $6,450 would be very bullish. Using comparisons of monthly BTC candlesticks, we can make the assumption that a bottom is likely near. If the price were to close above $6,450, it would have major bullish implications and could mean that the bottom is already in.
The post Bitcoin has Already Bounced by 42% Since the Bottom appeared first on BeInCrypto.
origin »Bitcoin price in Telegram @btc_price_every_hour
Bitcoin (BTC) на Currencies.ru
|
|