2020-10-5 13:09 |
Bitcoin (BTC) is still trading above an important long-term support level and is expected to eventually make another attempt at breaking out above $11,200.
Overcoming this resistance, or rejection from it, will likely determine the direction of the macro trend.
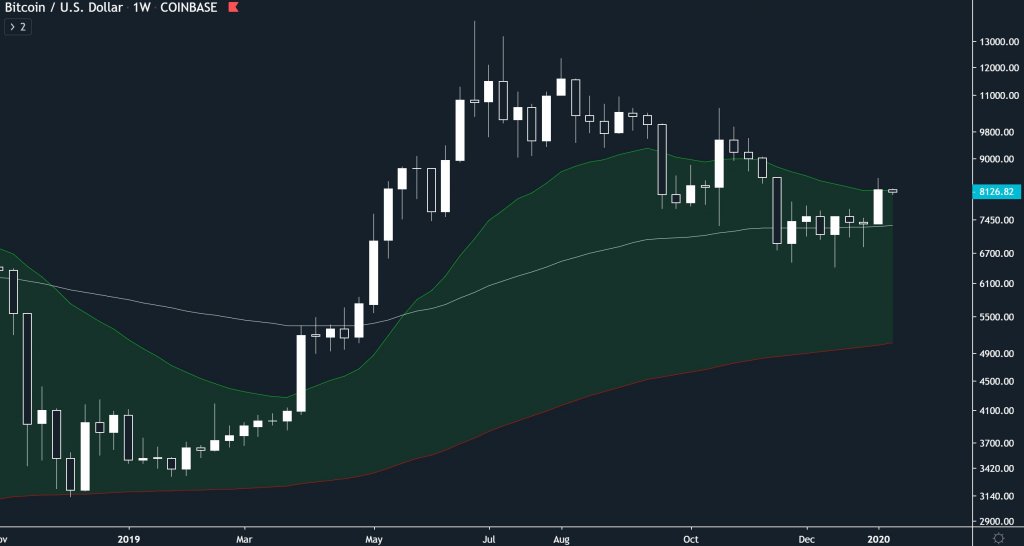
Bitcoin Weekly ConsolidationThe weekly chart shows that BTC is still trading above the long-term $10,200 support level. After validating the area with a lower wick two weeks ago, the price consolidated above it. As it stands, the movement looks like a re-test of a previous resistance area which is now likely to act as support.
Technical indicators are bullish. The RSI is above 50 and has possibly begun to increase and the Stochastic Oscillator is doing the same. There is no bearish divergence developing.
BTC Chart By TradingView BTC Struggles to Overcome ResistanceThe daily chart supports the presence of buying pressure, as evidenced by the bullish engulfing candlestick created on Sept 24 and the long lower-wick on Oct 2.
However, BTC is facing very strong resistance at $11,200, which is also the 0.618 Fib level and a previous support area. The $11,200 resistance also coincides with a potential descending resistance line connecting the two most recent lower-highs.
Until Bitcoin can successfully break out above this level, the upward trend is not confirmed.
BTC Chart By TradingViewTechnical indicators are bullish:
The MACD is increasing and has almost reached the positive territory The Stochastic RSI has made a bullish cross and is moving upwardsHowever, the RSI is below 50 and faces resistance from the descending line.
Based on technical indicators it seems likely that BTC will re-test the $11,220 area once more.
BTC Chart By TradingView Short-Term MovementIn the shorter-term 2-hour chart, we can see that the price was rejected at the 0.618 Fib level and also validated the previous ascending support line.
If the price fails to clear this level, it could decrease towards $10,500 before making another attempt at breaking out. If not, the price could immediately reclaim the level and continue moving upwards.
BTC Chart By TradingView Wave CountThe BTC price likely began a bullish impulse on Sept 9 (in orange below), and looks to currently be in wave 3.
Inside wave 3, the price has completed sub-waves 1-2 (blue) and has just begun the third, which could end between $11,985-$12,314.
BTC Chart By TradingViewTo conclude, it’s possible that BTC has completed its correction and will soon begin to increase. A breakout and reclamation of the $11,200 level would likely confirm this forecast.
For BeInCrypto’s previous Bitcoin analysis, click here!
Disclaimer: Cryptocurrency trading carries a high level of risk and may not be suitable for all investors. The views expressed in this article do not reflect those of BeInCrypto.
The post Bitcoin Gears Up for Another Attempt at Moving Above Resistance appeared first on BeInCrypto.
origin »Bitcoin price in Telegram @btc_price_every_hour
Resistance (RES) на Currencies.ru
|
|