Bitcoin fractal hints at steeper correction if bulls fail to hold $30k

Bitcoin fractal hints at steeper correction if bulls fail to hold $30k
фото показано с : coinjournal.net

2021-1-22 13:40

Bitcoin (BTC) price could dip to $21,820, which is the 21-EMA on the weekly time frame

Bitcoin’s bad week could get worse if the price dips below $30,000 again to retest intraday lows of $28,800.

At the moment, bulls are looking to bounce right back into the game, which will happen if they break above the previous support-turned-resistance level at $32,000.

A rejection leading to a slip beneath $28,000 could see a potentially bearish scenario to lows of $21k—$18k. This outlook will be likely if a 2017 fractal charts again.

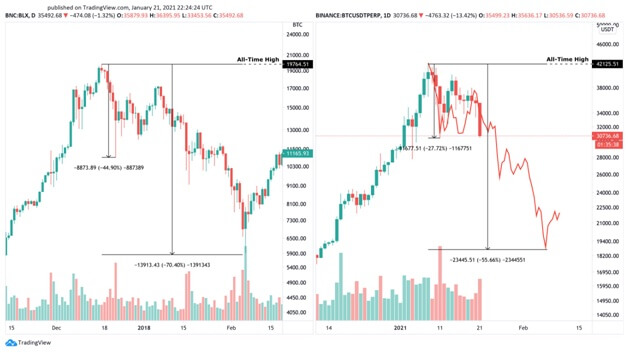
According to technical analyst Ali Martinez, bears could push as far as $18k if BTC’s price trajectory mirrors the 2017 fractal post-ATH. A 70% dump from the all-time high saw BTC bottom out around $5,900 as the 2018 bear market unfolded.

The analyst thinks something similar to that could materialise in the coming days (or weeks). He shared the chart below and added:

“If something similar to what happened in mid-December 2017 repeats, Bitcoin may dive towards $18,000.”

Image showing BTC price action in 2017/2018 and 2020/2021. Source: Ali Martinez on Twitter

An on-chain metric called Spent Output Profit Ratio (SOPR) also suggests BTC price could see further dips. SOPR helps gauge trends by showing whether spent outputs are in profit or loss. If the metric reading is above 1, it indicates output transactions were in profit. Values less than 1 mean that holders were at a loss when the output transaction happened. Sell pressure mounts when the metric suggests most holders are in profit.

According to Rafael Schultze-Kraft, Bitcoin’s dip from highs of $38,000 to support at $28,800 “is not surprising“. Rafael, who is the CTO of Glassnode, says that currently, the SOPR is overextended and moving towards 1. The metric thus suggests that less BTC is moving on-chain as some holders sell at “extreme profits“.

Bitcoin SOPR metric suggests further sell-off pressure. Source: Glassnode

As seen on the 4-hour chart below, BTC/USD has had multiple candle-down closes below the major support level around $32,000. Turning this previous support zone into resistance adds credence to the likelihood of a further breakdown.

If the decline continues, the key price level to watch on a higher time frame is the 21-EMA. Short-near-term price action is likely to include a revisiting of the weekly 21-EMA before another leg higher. The price level of the moving average is around $21,820.

BTC/USD 4-hour chart. Source: TradingView

On the contrary, a daily close above $30k, with highs of $32k in between could preserve the upside outlook. A move towards the $35k threshold will be the short term target if bulls have to consolidate towards a retest of the $42,000 resistance level.

The post Bitcoin fractal hints at steeper correction if bulls fail to hold $30k appeared first on Coin Journal.

Similar to Notcoin - TapSwap on Solana Airdrops In 2024

origin »

Bitcoin (BTC) на Currencies.ru

$ 61663.75 (-0.80%)
Объем 24H $25.88b
Изменеия 24h: -2.14 %, 7d: 7.77 %
Cегодня L: $61663.75 - H: $63112.23
Капитализация $1214.505b Rank 1
Цена в час новости $ 31657.08 (94.79%)

bitcoin fail 30k bulls hold fractal hints

bitcoin fail → Результатов: 126


Founder of Adamant Capital: Bitcoin Exchanges, Custodians Could Fail Like “Pre-1914 Gold Banks”

Bitcoin has seen a lot of success in the last couple of days, pulling analysts out of the woodwork with their own comments about what makes the industry last. The founder of Adamant Capital, Tuur Demeester, suggested that the exchanges and custodians involved with Bitcoin “are too big to fail” in a post on Twitter. […]

2019-5-15 17:21


Фото:

Bitcoin Bears Fail Miserably in Stopping Huge Institutional Demand For Crypto

As much as some cynics, such as traditional investor Mark Dow, like to paint it, institutions are heavily invested in the crypto space already. Sure, the Chicago Board Options Exchange (CBOE) recently divulged that it intends to put its Bitcoin (BTC) futures vehicle on the backburner, but investment statistics accentuate that big names are flooding.

2019-4-24 14:25


Understanding Bitcoin During 2019 Bear Market: A Little Knowledge in a Lot of Areas

The widely-followed and respected bitcoin analyst and financial economics student Misir Mahmudov has said “most educated people fail to appreciate bitcoin because they only specialize in one field,” then goes on to argue that true understanding is really grasped if you can understand basic computer science and economics concepts. Most educated people fail to appreciate […]

2019-3-20 06:39


Фото:

Bitcoin Price Analysis: Slow Grind Could Lead to Short Squeeze

Last Friday, we discussed a macro resistance level bitcoin would likely test. The level was tested three times prior and immediately rejected. Now, for the fourth time, we find ourselves situated above the level as we wait to see if our support holds:Figure 1: BTC-USD, Daily Candles, Fourth Test of Macro ResistanceThe first three attempts to hold support above the black, broken resistance have been stifled with relatively high amounts of volume.

2019-3-19 01:17


Фото:

Bitcoin Price Analysis: Could Three Times Be the Charm for This Resistance Level?

Bitcoin remains in its tightly coiled range as the market continues its sideways trend for the third week in a row. While macro support has been tested three times recently, we have yet to test the overhanging macro resistance:Figure 1: BTC-USD, Daily Candles, Narrow RangeThe blue zone outlined above shows a very strong zone of support that, over the last few weeks, has seen three strong tests and has led to a slowly upward-drifting market consolidation.

2019-3-16 01:56


Bitcoin Short Positions Rise as BTC Faces Growing Resistance at Critical 4,000 Level

After facing increased levels of selling pressure yesterday, Bitcoin as been able to maintain above $3,900, which is increasingly becoming a level of support for the cryptocurrency. Despite this, $4,000 still remains a key level of resistance for BTC, and the crypto’s short positions are rapidly climbing as it continues to fail to break above.

2019-3-13 03:00


Фото:

Bitcoin Price Analysis: Keep an Eye Out for a Close Above the Current High

Shortly after falling from its test of the low $4,000s, bitcoin managed to find support in the mid $3,500s. This has proven to be a relevant level over the last few months, and finding support here would be a sign of relatively strong demand:Figure 1: BTC-USD, Daily Candles, Local SupportThe high candle spread rejection following our test of the low $4,000s was an indication that we had strong levels of supply left in the market, but for the time being we are holding support.

2019-3-1 03:44


Фото:

Bitcoin Price Analysis: Consolidation Breaks Out Into Macro Resistance Test

Over the course of the last 10 days, bitcoin has managed to rally nearly 20% in value as it burst through two major resistance levels and is now beginning the test of a major macro level:Figure 1: BTC-USD, Daily Candles, Macro ResistanceWe can see a clear, descending supply-and-demand channel that governed the market for the last two months.

2019-2-20 01:38


Фото:

Bitcoin Price Analysis: After Sudden Upswing, Bitcoin Price Drifts Downward

Last week, we saw a violent move to the upside as bitcoin rallied 11% over the course of one day. Since peaking in the upper $3,600s, bitcoin has seen close to zero bullish follow-through, and the price has begun to drift downward over the course of the last week:Figure 1: BTC-USD, Hourly Candles, Downward DriftDownward-drifting markets like this can often be a sign that distribution is taking place.

2019-2-15 00:21


Фото:

Bitcoin Price Analysis: Strong Move Likely Following Tightly Coiled Market

Days and days of sideways consolidation and tightening volume has been the name of the game for the bitcoin market. A narrow range of $200 has caused a weeks worth of activity to coil and consolidate in preparation for bitcoin’s next move:Figure 1: BTC-USD, Daily Candles, Narrow RangeThe figure above shows just how narrow the range has been over the last week as the market has continued to grind out support and fail to break above overhanging resistance.

2019-1-26 03:13