2019-10-17 23:08 |
A number of technical indicators estimated that the entire market was susceptible to a downturn. Now that the bearish outlook seems to be validated, here is where Bitcoin, Ethereum, and Litecoin could be heading next.
BitcoinOver the last three weeks, Bitcoin has been consolidating between $7,800 and $8,550. But, on Oct. 11 this cryptocurrency went through a bullish impulse that pushed it to $8,815. Some of the most prominent analysts in the crypto community saw this upswing as a postive sign. However, the buying pressure behind it was not strong enough to support the bullish move and Bitcoin went back into the $750 trading range where it was trading at.
Based on its 1-day chart, Bitcoin’s upward momentum was contained by the 200-day moving average. This moving average served as strong resistance and the price rejection let an evening star candlestick pattern form.
This is considered a bearish reversal formation that occurs at the top of an uptrend. Evening stars are composed of three candlesticks: a long green candle, a short candle, and a red candle. The combination of these three candlesticks indicated that BTC was losing its bullish momentum and was likely to reverse.
Bitcoin indeed pulled back into the no-trade zone where it had been consolidating. Now, this cryptocurrency seems to be on its way down to test the $7,800 support level once again.
Breaking below this level of support could trigger a sell-off that takes BTC to around $6,900 or $6,300. Such a steep decline will confirm the 31.50 percent drop estimated by the descending triangle that developed between June and September.
Nonetheless, a spike in volume around the $7,800 support level could allow BTC to rebound to $8,550. This hypothetical rally could take this crypto to finally break above the 200-day moving average and surge to $9,500 or even $10,000.
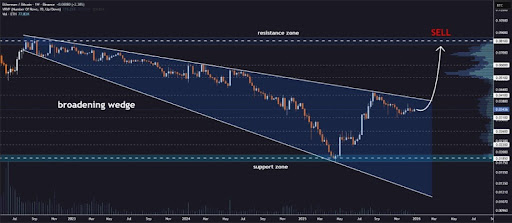
BTC/USD by TradingView EthereumEthereum was contained within an ascending parallel channel on its 1-day chart since Sept. 26. Every time it reached the bottom of the channel it bounced off to the middle or the top. But, when it reached the top, it fell back to the middle or the bottom.
However, ETH is now breaking out of the ascending parallel channel, which appears to be part of a major bear flag that was forming since mid-September. This is considered a continuation pattern that developed after the 31 percent plunge this crypto experienced from Sept. 20 until Sept. 26, known as the flagpole—which was succeeded by the recent consolidation period, known as the pennant.
If this bearish formation is confirmed, it is likely that Ethereum will end up moving in the same direction of the previous trend—predicting a 24 percent drop from the breakout point (determined by measuring the height of the flagpole). Such a retracement could take this cryptocurrency down to $138.
Although the outlook for ETH is currently bearish, a series of support points could prevent it from further decline. On its way down, these are the price levels that could act as barriers stopping the fall: $169, $157 and $147. If these price hurdles fail to act as support points, then this cryptocurrency could soon be worth $138.
Nevertheless, if Ethereum is able to regain the $177 level as support the chances for a swing high increase. In fact, a spike in volume could invalidate the bearish outlook taking Ethereum to test the next resistance levels at $184, $195 or even $207.
ETH/USD by TradingView LitecoinLike Bitcoin, on Oct. 9 Litecoin broke out of the no-trade zone where it was trading since Sept. 24. But, the bullish momentum was not supported by the necessary volume to allow a higher push to the $64 resistance level. As a result, LTC pulled back below $57.70 and is currently trading around the $53 support level.
Based on the 12-hour chart, the Bollinger bands began squeezing on Oct. 4. Squeezes are indicative of periods of low volatility and are typically succeeded by periods of high volatility. Now that LTC appears to be breaking below the lower Bollinger band, the high volatility expected could turn into a strong downward move.
If Litecoin is able to successfully close below the $53 support level, the bearish scenario could be validated. If so, then this cryptocurrency could test the next levels of support that sit at $49 and $44. Conversely, a spike in volume with a clear break above $57.70 could take LTC to $64 or even $71.
LTC/USD by TradingView Overall sentimentAs seen in this technical analysis, the lack of buying pressure did not allow Bitcoin, Ethereum, and Litecoin to reach higher price levels. As a result, these cryptocurrencies began depreciating over the last few hours adding credibility to the bearish scenarios previously explained. If the sell-off continues and Bitcoin breaks below $7,800 it is extremely likely that the entire market will follow through. Thus, it will be wiser for traders to wait for further confirmation in order to avoid trying to catch a falling knife.
The post Bitcoin, Ethereum and Litecoin sink as buying pressure fades appeared first on CryptoSlate.
origin »Bitcoin price in Telegram @btc_price_every_hour
Bitcoin (BTC) на Currencies.ru
|
|