2020-9-28 11:14 |
The Bitcoin (BTC) price is approaching a crucial resistance area, a breakout above which would confirm that the trend is bullish.
Technical indicators and the wave count suggest that a breakout is expected.
Bitcoin Creates Weekly Hammer CandleDuring the week of Sept 21 – 28, the Bitcoin price created a hammer candlestick. Even though it had a bearish close, the hammer re-validated the $10,100 area as support, leaving a long lower wick in its wake, a sign of buying pressure.
Technical indicators remain bullish. Both the RSI and stochastic oscillator are moving upwards, but have not yet reached the overbought region.
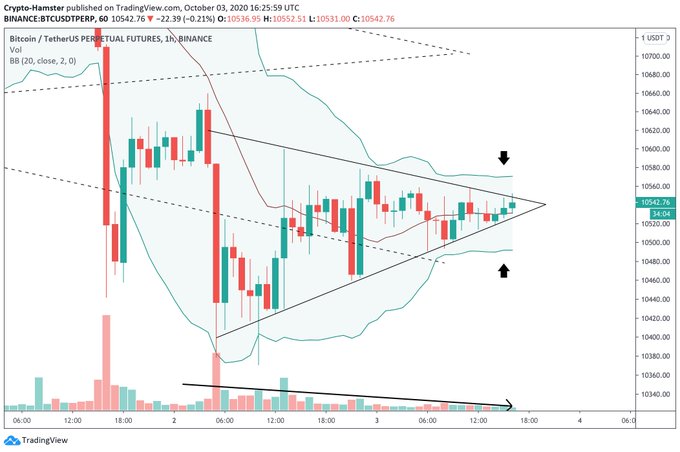
BTC Chart By TradingViewThe daily chart shows that while the price has already created a higher-low and followed up with a bullish engulfing candlestick, there is very strong resistance at $11,150.
Besides being a previous support area that flipped into resistance on Sept 19, the area coincides with a descending resistance line drawn since the Aug 17 high, increasing its significance.
A breakout above the $11,150 area and the descending resistance line would help to confirm that the trend is bullish.
BTC Chart By TradingView Descending Resistance LineTechnical indicators in the daily time-frame are bullish.
The Stochastic Oscillator has made a bullish cross The RSI has moved above 50 The MACD has nearly reached positive territory.A cross of the MACD into positive territory would be the final confirmation that the upward trend has begun.
BTC Chart By TradingViewThe shorter-term 6-hour chart also suggests a bullish outlook. After initially being rejected, BTC has moved above the 0.618 Fib retracement level and is currently at the 0.786 Fib.
Technical indicators are bullish. Both the RSI and MACD are increasing, and the latter has crossed into positive territory.
While it’s possible that the price retraces back towards $10,500, the most likely scenario is that BTC will make a move upwards to break out from the $11,150 area.
BTC Chart By TradingView Wave CountThe latest BTC spike makes it likely that it began a bullish impulse (shown in orange below) on Sept 9 and has completed sub-wave 1.
It is probable that the impulse at the beginning of the longer-term wave 5 (in black below), could take the price all the way to $15,000.
A drop below the ascending support line that has been in place since July (0-2 line) and the previous low of $10,138 would be a sign that this count is incorrect. A decrease below the wave 1 high (red dotted line) at $9,485 would almost certainly invalidate the bullish count.
BTC Chart By TradingViewIn the shorter-term, we can see that BTC is in the process of completing the first minor sub-wave (blue) of the third wave (orange).
The three most likely targets for the latter to end are found at $12,180, $12,880, and $13,380, depending on how much the wave extends. The target should become more clear once more minor sub-waves are completed.
BTC Chart By TradingViewTo conclude, it’s likely that BTC has begun a new upward move which could take the price to a new yearly high. A decrease below $10,138 would put the formation in doubt, while a drop below $9,485 would invalidate it.
For BeInCrypto’s previous Bitcoin analysis, click here!
The post Bitcoin Continues Ascent After Bouncing Back appeared first on BeInCrypto.
origin »Bitcoin price in Telegram @btc_price_every_hour
Bitcoin (BTC) на Currencies.ru
|
|