2020-11-12 12:18 |
Bitcoin (BTC) has been decreasing since being rejected by the $15,800 resistance area on Nov 9.
Despite the drop, the price has been retracing and is trading inside a bullish pattern from which a breakout is expected.
Bitcoin’s Potential TriangleThe Bitcoin price is currently trading only slightly below the $15,800 resistance area. The price created what resembles a double top inside the resistance zone and dropped afterward. The double top was combined with a bearish divergence in the RSI.
However, the decrease was bought up quickly and left two long lower wicks in its wake. This served to validate an ascending support line that has been in place since Nov 3. The price has been increasing above this line since.
If BTC breaks out from the triangle and increases the entire height of the pattern, it could reach a high of $17,200.
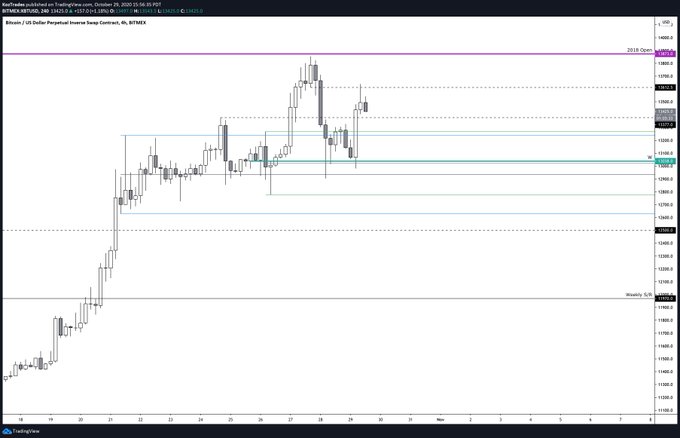
BTC Chart By TradingViewIn the short-term, the price is currently attempting to move above the 0.618 Fib level of the aforementioned decrease, having potentially created another short-term ascending triangle.
If the price moves above the 0.618 Fib level of $15,460, which commonly acts as the top of the retracement in corrections, the rate of increase is likely to accelerate.
Technical indicators support this movement since the MACD is increasing and is above 0 while the RSI is also consolidating above 50.
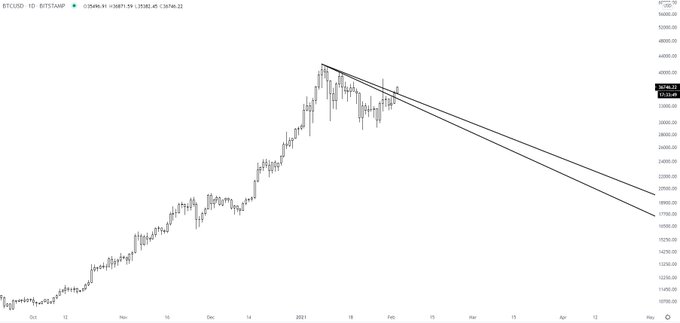
BTC Chart By TradingView Long-Term MovementThe weekly BTC chart shows that there are two crucial Fib resistance levels above the current price, found by measuring from the 2017 all-time high price.
The levels are found at $16,100 and $17,200, the 0.786 and 0.854 Fib levels respectively. The latter level also aligns with the triangle breakout target, making it a likely place to act as the top.
Therefore, a potential breakout from the triangle could take the price towards this level. Currently, there are no bearish signs to suggest that the price will reverse its trend.
BTC Chart By TradingView Wave CountBitcoin’s wave count also indicates that a breakout could occur and gives a very similar target between $16,100-$17,200.
The target is found by projecting the length of subwaves 1-3 to subwave 4 (blue & orange). This is also the 4.618 Fib extension of sub-wave 1 (blue).
BTC Chart By TradingView ConclusionTo conclude, the Bitcoin price is expected to eventually break out from its current pattern and move towards a local high of $17,200.
For BeInCrypto’s latest Bitcoin analysis, click here!
Disclaimer: Cryptocurrency trading carries a high level of risk and may not be suitable for all investors. The views expressed in this article do not reflect those of BeInCrypto.
The post Bitcoin Consolidates in Anticipation of a Breakout appeared first on BeInCrypto.
origin »Bitcoin price in Telegram @btc_price_every_hour
Bitcoin (BTC) на Currencies.ru
|
|