2019-10-10 18:31 |
So far, BCH has had a mixed year. In the last 12 months, BCH experienced a decent drop that saw its price fall nearly 54% in USD and 64% against BTC.
BCH, currently ranked #4 by market cap, is down 2.70% over the past 24 hours. BCH has a market cap of $4.16B with a 24 hour volume of $1.5M. Majority of trading volume comes from Coinbene and Biki and their pairs: BCHUSDT.
Total market cap analysisLet’s take a look at what the overall market is doing. It is a well known fact that all coin prices are highly correlated with bitcoin’s price action and by extension with the whole market. Every time we see a surge or plunge of the total market cap, it spills over to the individual coins and their prices.
Read our updated guide on best trading bots.
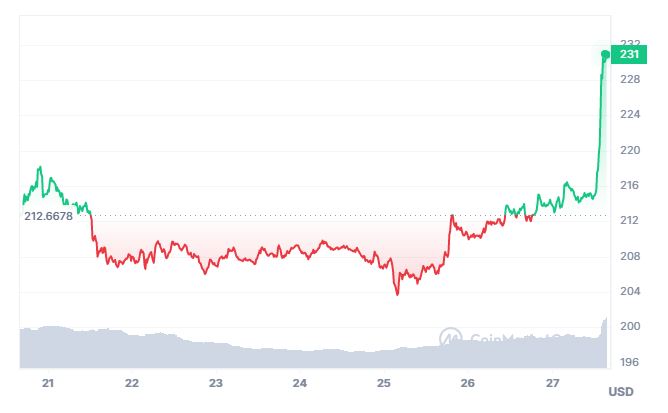
Market has made a solid recovery yesterday, gaining around $7 billion, lead by bitcoin and high cap altcoins. The market managed to break through the sturdy resistance at $214 billion (data by Tradingview, CMC data is off by approx +$8 billions). It hit the EMA20 which acted as a resistance and the market bounced off of it. We are right now at $222 billion and should the total cap break through the above mentioned EMA resistance zone, we could see a swift move up to the $240 billion zone, area from which we saw this horrific drop in the last week of September.
BCHUSDMajor Support Level: $219Major Resistance Level: $27778.6% FIB Retracement Level: $26961.8% FIB Retracement Level: $32238.2% FIB Retracement Level: $396RSI on a daily is oversoldMACD made a bullish crossoverBCH dropped by 2.7% today but it still up by 4.7% on the week.
When we zoom into a 4H chart, we can see BCH sitting on a EMA20 after failed attempt to break upwards. The MA50 is right below it and acts as the local support zone for BCH.
BCHBTCWeekly chart shows BCH losing against bitcoin, having closed red candles in the last 3 weeks in a row.
Daily chart illustrates BCH struggling to break the 3.1M satoshis zone which is a horizontal resistance level and Fib618 simultaneously. The price is right below the EMA20 which acts as a resistance zone at around 2.8 M sats.
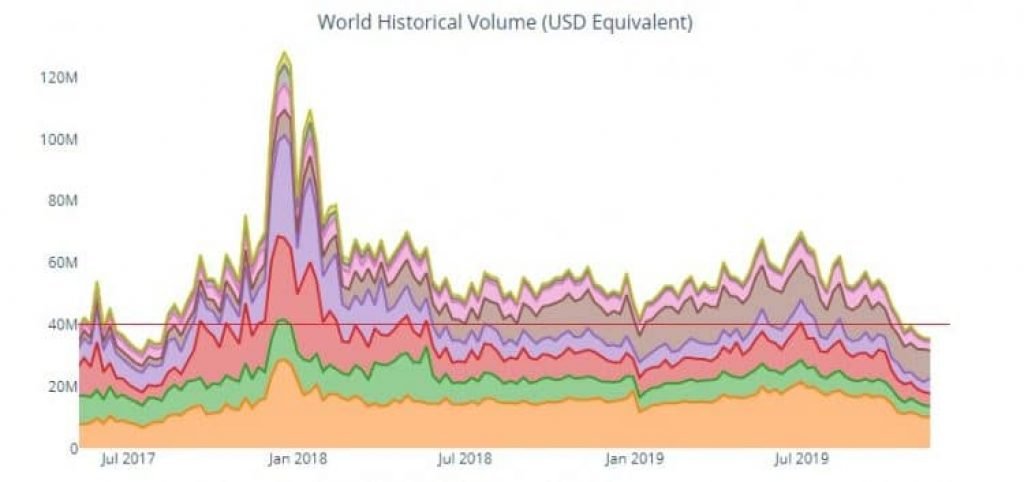
Support level: horizontal support level at 2.6 M satoshisResistance: horizontal line at 3.1M satoshisPotential upside scenario: blasting through the resistance at 3.1M sats to reach the July heights 4M sats.Potential downside scenario: dropping back to the horizontal support line at 2.5M satsMost likely scenario: hovering in the 2.5-2.9M sats zone, waiting for a market-wide impulse and volume increase before conquering new/old highs at 4M+ sats.Trading volume and buy supportTrading volumes are looking weak, according to Messari (data is different to CMC data): reported volume in the last 24 hours was $184m and “Real 10” volume was $20m. So, the reported volume is almost 9x larger than the “Real 10” volume (trading volume on the exchanges that prevent wash trading). This means that BCH’s liquidity is seriously inflated which is pretty commong among the top coins that have their metrics inflated by huge figures (20x discrepancy is not uncommon).
Read our updated guide on best BCH wallets.
Additionally, BCH comparatively has a weak buy support, according to coinmarketbook.cc. Buy support is measuring sum of buy orders at 10% distance from the highest bid price. This way we can eliminate fake buy walls and whale manipulation and see the real interest of the market in a certain coin. BCH currently has $10.7 million of buy orders measured with this method, which sets BCH buy support/market cap ratio at 0.25% which is a similar ratio to bitcoin and ethereum. Bitcoin and Ethereum have a 0.20% and 0.28% ratios, respectively. This novel metric indicates there are a lot of manipulations, inflated liquidity and fake orders on BCH trading pairs.
Other BCH NewsBCH is getting prepared to experience a new network upgrade. The Bitcoin Cash community performs bi-yearly improvements to the network to offer better services to users.
Read our updated guide on most profitable coins to mine.
On November 15, network participants should have their client updated for the enhancements to be implemented on the network.
The post Bitcoin Cash (BCH) Price Analysis: Boring Choppy Ranging appeared first on CaptainAltcoin.
origin »Bitcoin price in Telegram @btc_price_every_hour
Bitcoin Cash (BCH) на Currencies.ru
|
|